midt
• Guest Speaker Jason Strobbe- Going to Market in Wine

What “was” in the News 2016 this week
Mintel’s top 12 key trends for 2016
* Alternatives Everywhere: Novel protein sources and potential replacements means that what was formerly ‘alternative’ could take over the mainstream.
* Artificial: Public Enemy No. 1: Companies are removing artificial ingredients to meet consumer demand for natural food .
* Eco is the New Reality: Sustainability continues to evolve and has become a necessary part of new product development.
* From the Inside-Out: A market has been created for products enhanced with everything from collagen to probiotics .
* For Every Body: Promotion of athletic program’s that encourage consumers to get active has opened an opportunity for product ranges that progress alongside people’s activity levels and goals.
* Based on a True Story: Consumers have been romanced by product origin, ingredients or inspiration stories.
* e-Revolution: From Carts to Clicks: Online shopping, apps and delivery services transforming consumers’ access to food.
* Diet by DNA: Interest in historical ingredients suggests that consumers could design their own diets by connecting with their own ancestry or genetic make-up.
* Good Enough to Tweet: The rise of food-centric media continues. * Table for One: More consumers are living in single-person households or occasionally eating meals alone. * Fat Sheds Stigma: The awareness of the many sources of good fats is ushering in a paradigm shift in attitudes to fat.
* Eat with Your Eyes: More visual and share-focused societies call for innovation that is boldly colored and artfully presented
Americans' consumption of fruits and vegetables declined between 2003 and 2013 http://www.ers.usda.gov/amber-waves/2016-july/a- closer-look-at-declining-fruit-and-vegetable- consumption-using-linked-data- sources.aspx#.V4aQTPkrKbi
New Publication: http://newfoodeconomy.com/
![]()
![]()
![]()
![]()
![]()

![]()
![]()
![]()
What was in the News
Whole Foods 365-opens tomorrow • http://www.bizjournals.com/portland/blog/real-estate-daily/2016/07/sneak-peek-365-by-whole-foods-preps-for-its- grand.html?ana=e_ptl_rdup&s=newsletter&ed=2016-07-13&u=gHCQtKG4JgzdHlfOoL9yZg0dc64b5c&t=14684
Whole Foods Local Producer Loan Program Hits Milestone--Retailer has awarded $20 million to recipients
The latest loan went to Portland, Ore.-based café and juice bar Canteen-will be in LO 365 store
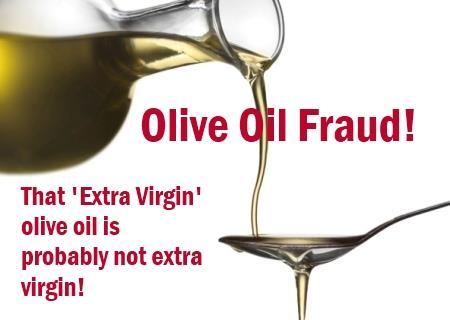
Phony Food
http://nypost.com/2016/07/10/the-truth-behind-how-were-scammed-into-eating-phony-food/
http://www.realfoodforlife.com/which-olive-oil-to-buy-the-olive-oil-fraud/
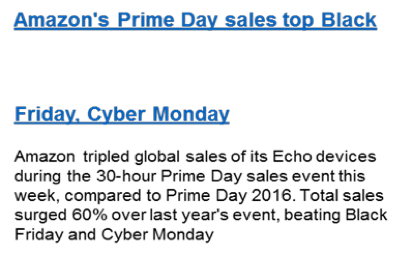
Amazon Prime- what percentage of users have it?
Food Vision 16: Are CPG biggest Guns Flogging dead Donkeys or can their brands be salvaged? http://www.foodnavigator- usa.com/content/view/print/1280311
Key forces Affecting the CPG Industry https://www.dropbox.com/s/jk0w5z26eco9il7/Screenshot%202016-07-06%2016.38.31.png?dl=0
![]()
![]()
![]()
![]()
![]()
![]()
![]()


What’s in the News
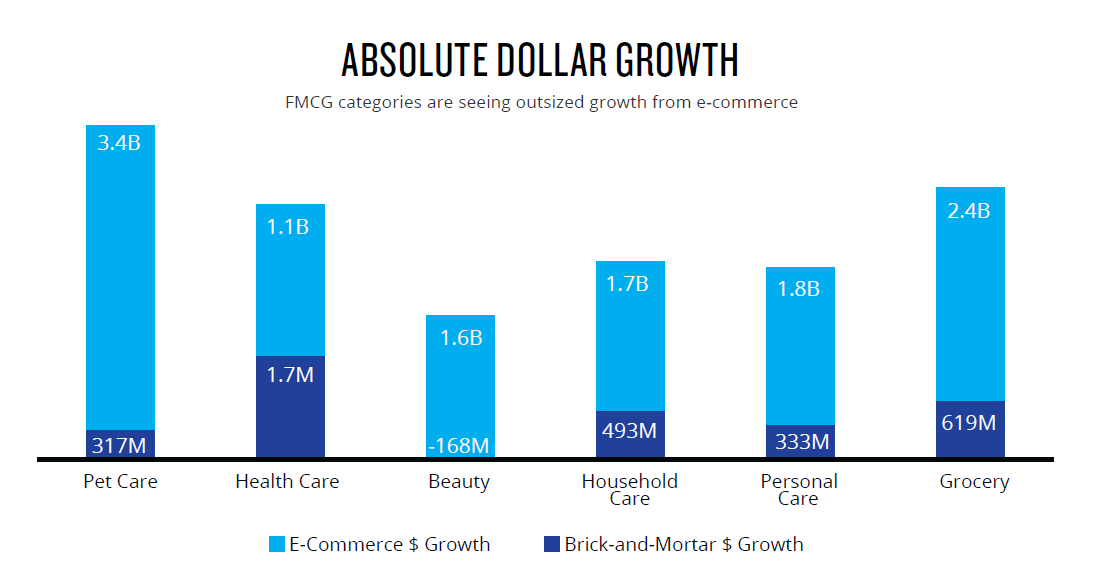
PepsiCo CEO navigates brave new retailing world: ‘The lines are blurring between channels’
PepsiCo is boosting its e-commerce capabilities by ensuring that its products are optimized for shipping, and the firm is looking at the logistics of sending ice cold beverages directly to consumers, said CEO Indra Nooyi.
![]()
![]()
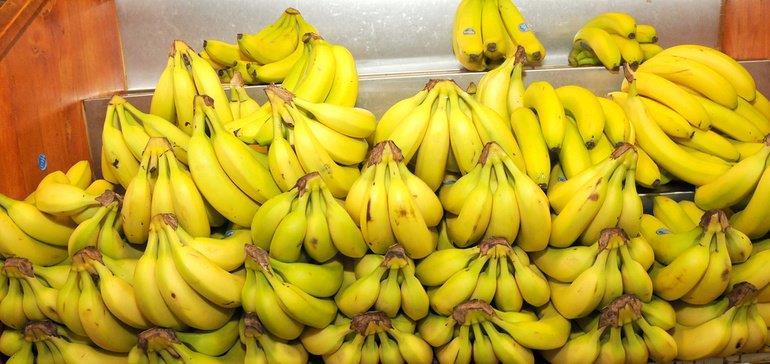
Clean label trend goes bananas with new fruit-based flour
Are Influencers "Ghosting" Snapchat?

![]()
Influencers seem to be moving away from social platforms like Snapchat,YouTube and Twitter for platforms like Instagram and Pinterest that are more profitable. This infographic by Collective Bias offers an in-depth look at the current state of social media and where it is headed. ...»
![]()
The formula for growth is simple. There’s really only three levers you can pull: find new buyers, get your buyers to spend more, and/or raise prices.

What’s in the News
Specialty food sales surge- Retail dollar sales of specialty products grew 20% from 2013-2015 to $94 Billion. Read More: http://supermarketnews.com/center-store/specialty-food-sales-surge#ixzz4EJtoqnBd
The top 10 specialty food categories in terms of 2015 retail sales volume were:
![]()
Cheese and cheese alternatives, $4.3 billion (up 14.7% from 2013-2015)
Frozen and refrigerated meat, poultry and seafood, $3.6 billion (up 23.1%)
Chips, pretzels and snacks, $3.5 billion (up 22.3%)
Coffee, coffee substitutes and cocoa (non-RTD), $3.2 billion (up 17.3%)
Bread and baked goods, $2.6 billion (up 14.7%)
Candy and individual snacks, $2.2 billion (up 21.4%)
Frozen lunch and dinner entrées, $1.9 billion (up 21.4%)
Condiments, dressings and marinades, $1.9 billion (up 10.4%)
Yogurt and kefir, $1.8 billion (up 27.6%)
Refrigerated entrées and prepared meals, $1.7 billion (up 34.5%).
![]()
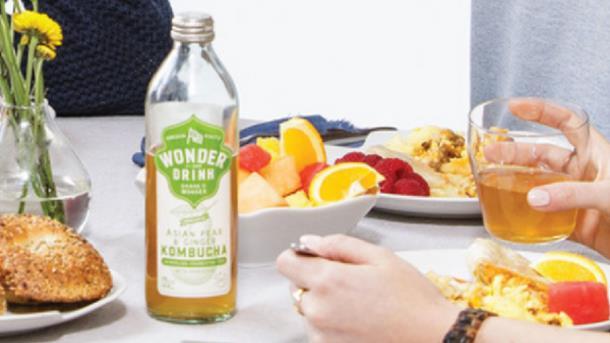
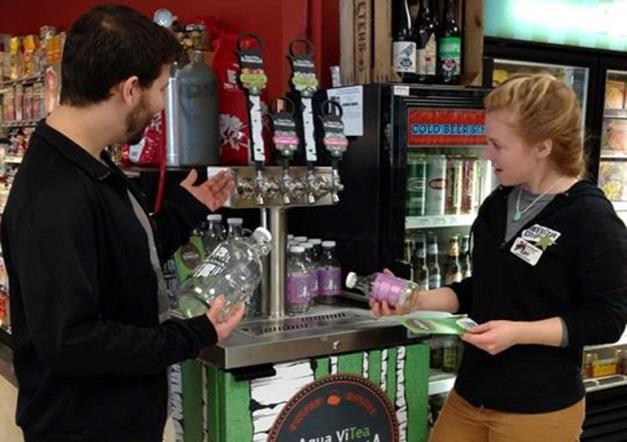
Is kombucha on tap a fit for your store?
http://newhope.com/merchandising/kombucha-tap-fit-your-
store?NL=NP-02&Issue=NP-02_20160713_NP- 02_523&sfvc4enews=42&cl=article_1&utm_rid=CNHNM000000122481 &utm_campaign=17162&utm_medium=email
![]()
![]()
![]()
![]()
TEST TIME Marketing Knowledge: Strategic assumptions Test Agree, Disagree, Don’t Know?
1. Differentiating our brand is a vital marketing task. 2. Loyalty metrics reflect the strength not the size of our brand. 3. Customer retention is cheaper than customer acquisition. 4. Price Promotions boost penetration not loyalty. 5. Who we compete with depends on the positioning of our brand image. 6. Mass marketing is dead and is no longer competitive. 7. Buyers have a special reason to buy our brand. 8. Our consumers are a distinctive type of person.
9. 20% of our customers deliver at least 80% of our sales.
8
The Need for Evidence based-Marketing
If you answered Yes, to most of these, you are operating under false assumptions
“Education consists mainly of what we have unlearned” Mark Twain (1898)
“It’s not what you don’t know that will hurt you, it’s what you know that ain’t so.” Sam Walton
9
From: Bryon Sharp How Brands Grow: what marketers don’t know, Oxford Press 2010
How Brands Grow: What Marketers Don’t Know
Growth in market share comes by increasing popularity; that is, By gaining more buyers (of all types) most of whom are light customers Who buy the brand only occasionally.
Brands even though they are slightly differentiated, mainly compete As if they are near look-a-likes; but vary in popularity (and hence market share).
Brand competition and growth is largely about building two market-based Assets; Physical availability and mental availability. Brands that are easier
to buy- for more people in more situations- have greater market share. Innovation and differentiation (when they work) build market-based
Assets, which last after competitors copy the innovation.
From: Bryon Sharp How Brands Grow: what marketers don’t know, Oxford Press 2010
Toward a New View Of marketing Priorities
Past World Model
Positioning Differentiation Message Comprehension USP Persuasion Teaching Rational involvement
New World Model
Salience Distinctiveness Getting Noticed/emotions Relevant Associations Refreshing/building memory structures Reaching Emotionally distracted viewers
From: Bryon Sharp How Brands Grow: what marketers don’t know, Oxford Press 2010
![]()
![]()
Consumer Behavior
Past World Model
Attitudes drive behavior Brand Loyals Brand switchers Deeply committed buyers Involvement
Rationally Involved viewers
New World Model
Behavior drives attitudes Loyal Switchers Loyal Switchers Uncaring cognitive misers Hueristics
Emotionally distracted viewers
From: Bryon Sharp How Brands Grow: what marketers don’t know, Oxford Press 2010
![]()
![]()
Brand Performance
Past World Model
Growth Through Targeting Loyal’s
Confusing Brand Metrics Price promo wins new buyers
Target Marketing Compete on Positioning Differentiation
New World Model
Growth Through Brand Penetration
Meaningful Brand Metrics Price promo reach existing Customers
Sophisticated mass marketing Compete with all brands in category Distinctiveness
From: Bryon Sharp How Brands Grow: what marketers don’t know, Oxford Press 2010
![]()
![]()
A List of Marketing Laws
Double Jeopardy Law –brands with less MS have fewer buyers that are slightly less loyal Pareto Law (60/40)- all brands lose some buyers, loss is proportional to market share Law of Buyer moderation-in future time periods heavy buyers, buy less Natural Monopoly Law –Brands with more MS attract light category buyers
User bases seldom vary –rival brands sell to very similar customer bases Attitudes and brand beliefs reflect behavioral loyalty- customers know and say more about
brands they use and say little about those they do not Usage drives Loyalty Buyers of different brands express very similar attitudes about their brands
Law of Prototypicality- Image attributes that describe a product are better than those that do not. Duplication of Purchase laws Brands customers bases overlap w/MS NBD-Dirichlet- mathematical model of purchase probabilities
From: Bryon Sharp How Brands Grow: what marketers don’t know, Oxford Press 2010
Go To Market Strategies
Producers
Consumers

Who is your Target Customer? What do they want? How big is the Market? What price/value proposition do you use?
How do you take your product to market? What Channels/ Partners do you use?
So What Channels can you reach Consumer with a new beverage or food product?
Channels
• Food Service--- Restaurants/bars/food carts • Institutional- schools, companies, prisons.... • Farmer Markets • Direct to Consumer- CSA- web
• Retail
Convenience Stores
Traditional Grocer
Club Stores
Super Centers
Discounts Stores
Dollars Stores
Drug Stores
Other?
Other Partners
Wholesalers-Independentor Captive
Distributors
SpecialtyDistributors
Brokers
Manufactureragents
Exhibit TN-6Aligning Company, Customers, Channels

![]()


Company
- Products and Value Proposition
Channels
- Go-to-market Strategies
Good Marketing Practice is Quality at this Critical Intersection


Customers
- Target Markets
Aligning Products, Markets, and Channels
•. Potential Costs of Misalignment •. Time, money, morale •. Fuzzy. segmentation •. Stranded assets along the channel chain •. Dilution of value proposition and positioning •. Requirements for Effective Alignment
•. Common vision of target segments •. Shared principles of channel management •. Effective channel partnerships •. The will and skill to change
Selecting Compatible Channel Partners


Purpose
Identity
Channel Partners
Values
Values
Company
Mirroring
![]()
![]()

![]()
![]()


Purpose
Kotler et.al.(2010)- Figure 5.1 Marketing 3.0, Wiley.
Identity

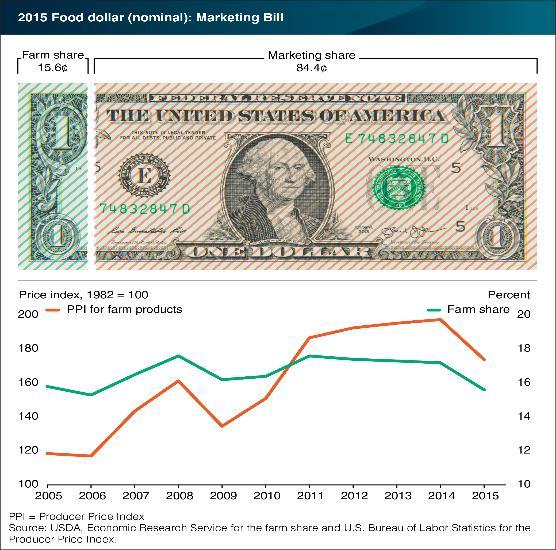
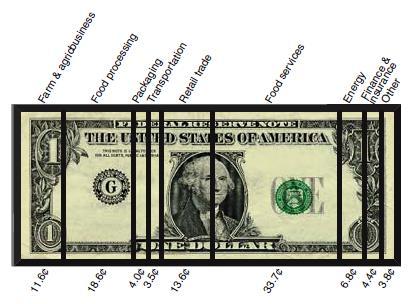
Food Share of Consumer Wallet
21.0% 20.0% 19.0% 18.0% 17.0% 16.0% 15.0% 14.0% 13.0% 12.0%
10.8% in 2012
Source WSJ 4/4/14, USDA data
![]()
![]()

![]()
![]()
![]()
![]()
![]()
![]()
![]()
![]()
![]()
![]()
![]()
![]()
![]()
![]()
![]()
![]()
![]()
![]()
![]()
![]()
![]()
![]()
![]()
![]()
![]()
![]()
![]()
![]()
![]()
![]()
![]()
![]()
![]()
![]()
![]()
![]()
1980 1985 1990 1995
2000 2005

Specialty Food Marketplace


State of Specialty Foods
Specialty Food Sales topped $109 billion in 2014 22% increase
Retail accounted for 78% and Food Service 22%
Cheese is still the number 1 category; $3.7 billion in sales
Snacks is the fastest growing category
Proteins show significant growth: Free Range, Grass Fed
48% of manufacturers represented growth of 20% or more
Local and All-Natural is the most interesting to consumers
Source: Specialty Food Association
23
State of Specialty Foods
Natural & Organic pacing growth for distributors and retailers
Kroger reported $11 billion in Natural & Organic sales
Gluten Free continues double digit growth
Millennials focused on authentic brands in ethnic categories
Huge shift from full service models to non-service models
Supply chain efficiency to drive down costs
Source: Specialty Food Association
24
State of Specialty Foods
Growth of Specialty/Natural Retailers Sprouts Fresh Thyme Mariano’s The Fresh Market Lunds/Byerly’s Central Market Market District Market 32 New Seasons/New Leaf 365 by Whole Foods
Large traditional supermarkets transforming product assortment across entire store. Albertson’s/Safeway Kroger Walmart
Source: Specialty Food Association
25
| Crossing the Chasm- Organic Food Niche Market Mainstream Market
| ||||
|
|
|
| ||
|
| ||||


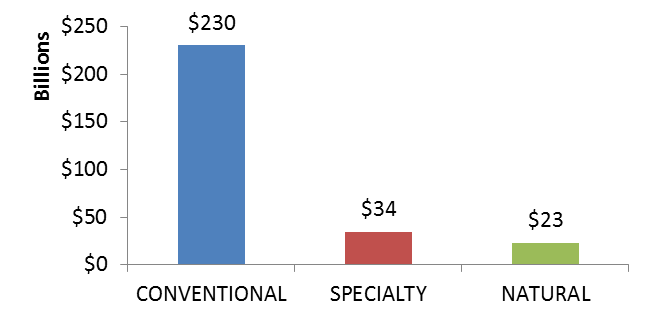
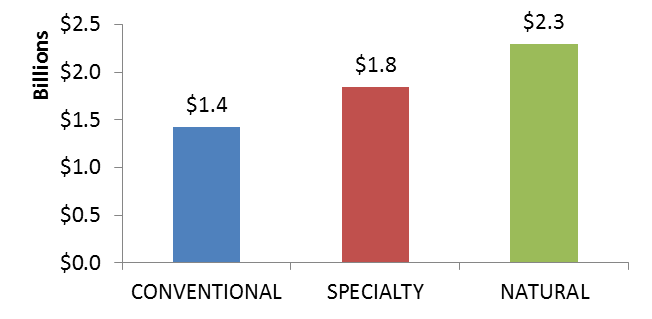
State of the Industry
Natural Driving Growth
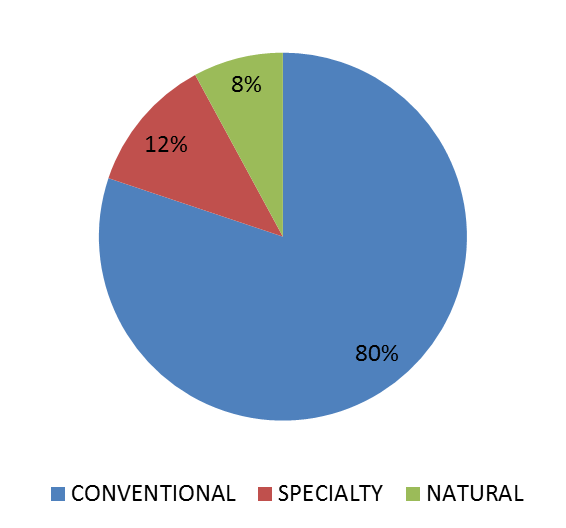
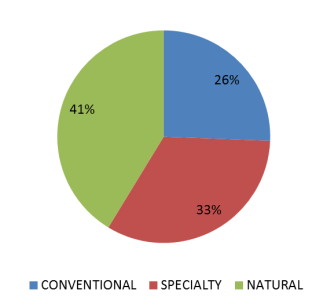
![]()
% of $ Sales
% of $ Growth
![]()
Source: IRI/SPINS 52 weeks ending 3/22/15
$ Sales
$ Growth
27
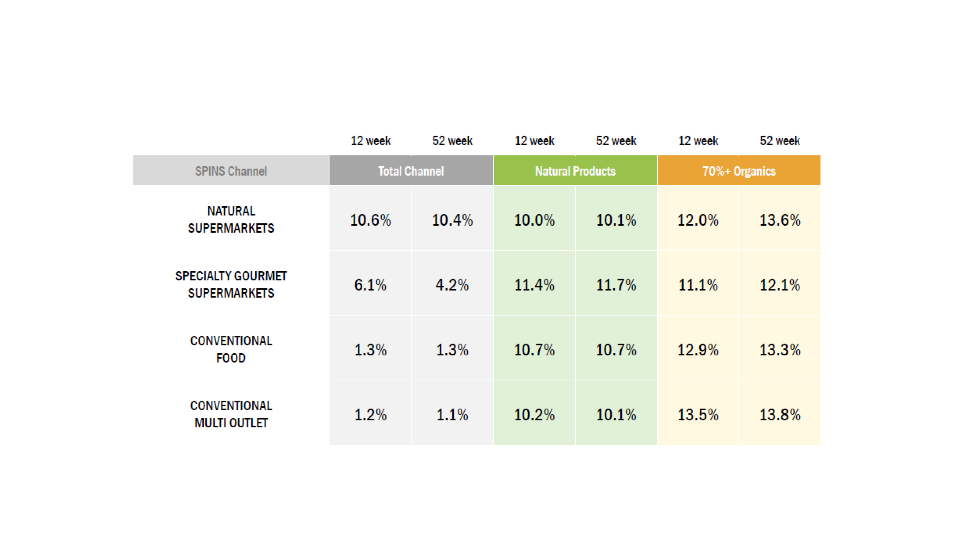
Organic Growth Outpacing Natural Growth


State of the Industry

Source: SPINSscan Conventional wks ending 12/28/2014
28
Total US Growth by Category and Product Type
State of the Industry

![]()
![]()
![]()
ALL PRODUCTS
FROZEN & REFR MEATS POULTRY & SEAFOOD
BREAD & BAKED GOODS PACKAGED FRESH PRODUCE +3%
+.7% +6% +11% Conventional Specialty Natural
+5% +10% +23%
+9% +17% +20% +19% +15%
+11% +29%
+4% +11% +.6% +17% -.7%
![]()
![]()
![]()
![]()
![]()
![]()
![]()
![]()
-.2% +2%
![]()
![]()
![]()
![]()
![]()
![]()
![]()
CARBONATED BEVERAGES
CHEESE & CHEESE ALTERNATIVES
CHIPS PRETZELS & SNACKS
FZ LUNCH & DINNER ENTREES
BEER
MILK
PAPER & PLASTIC & HOUSEHOLD PRODUCTS
-2% +6% +7% +7% +.6% +6% -2% +5% -2% +6%
![]()
![]()
![]()
![]()
![]()
![]()
![]()
![]()
![]()
![]()
![]()
![]()
![]()
![]()
![]()
![]()
![]()
![]()
![]()
![]()
+13%
![]()
![]()
![]()
![]()
Source: IRI/SPINS 52 weeks ending 3/22/15
29
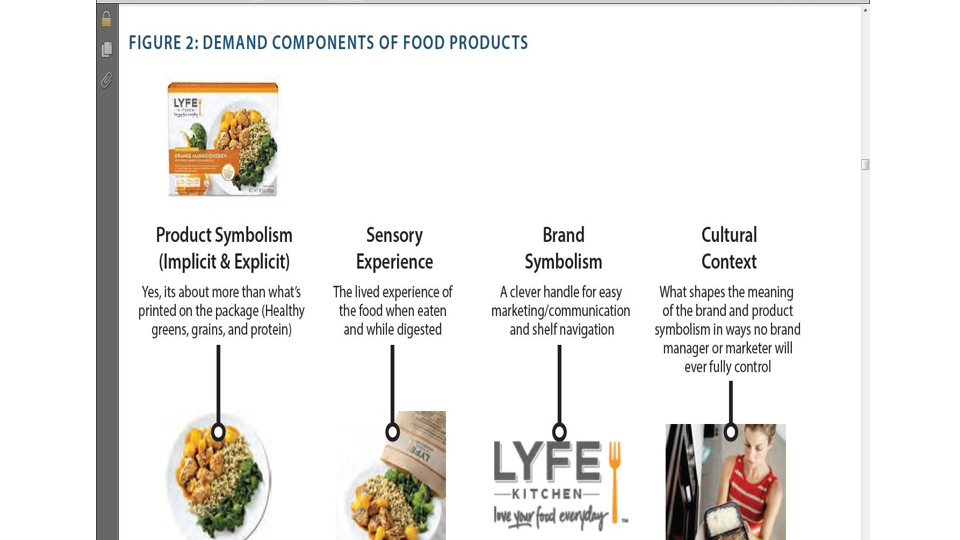
Source: Hartman Group The Curious Role of Brand
http://www.hartman-group.com/
![]()
30
State of the Industry
![]()
![]()
![]()
14% 12% 10%
Consumers Flock to Fresh
Dollar Trend
Volume Trend
Price Change
![]()
![]()
![]()
![]()
![]()
8% 6% 4% 2% 0%
![]()
![]()
![]()
![]()
![]()
![]()
![]()
![]()
![]()
![]()
![]()
![]()
![]()
![]()
![]()
![]()
![]()
![]()
![]()
![]()
![]()
![]()
![]()
![]()
![]()
![]()
![]()
![]()
![]()
![]()
![]()
![]()
![]()
![]()
![]()
![]()
![]()
-2% -4% -6% -8%
![]()
![]()
![]()
![]()


![]()


Dollar growth for all & volume gains in most; higher prices part of the mix too
Source: Nielsen Perishables Group FreshFacts , Total U.S. – Fresh Coverage Area (grocery + WM, Sam’s Club and Target); 52 weeks 31 ending 10/25/2014 (vs. year ago)

State of the Industry
Value & Convenience Drive Store Expansion
![]()
![]()
![]()

Convenience Drug
Dollar Stores Mass Merch Supercenters Warehouse Clubs
Source: Nielsen TDLinx
U.S. Store Counts
41,378 33,445
25,486 4,071
4,014 1,286
151,282
69% + of growth from niche formats
![]()
![]()
![]()
![]()
Supermarkets $2MM+
Supermarkets
![]()
![]()
![]()
![]()
![]()
![]()
![]()
2013
vs. 2005 Value & Convenience
32
![]()
![]()
![]()
Small Formats Driving Store Expansion
% of U.S. Store Count Expansion in the Top 20 Expansion Chains – 2013 versus 2007
State of the Industry


![]()
![]()
21%
16,570 new stores
Dollar Stores C-Stores Drug Stores Grocery Mass Merchandisers
7%
5% 36%
![]()
![]()
![]()
Source: Nielsen TDLinx
32%
33
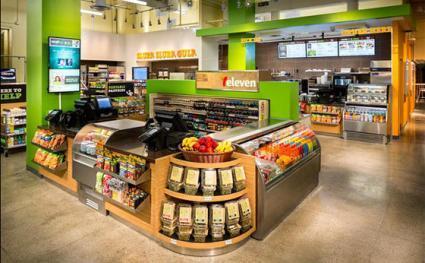
7-Eleven Rebrands &
Aims Higher
7-Eleven is rolling out a series of better-for- you snacks in a bid to attract Millennials.
USA TODAY Sep. 12, 2013
State of the Industry


Source: 7-Eleven & FastCoDesign.com
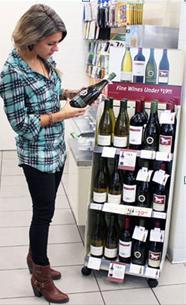
7-Eleven “added four high-demand A-listers to its lineup at its top wine-selling stores”

Seeks to attract health-conscious millennials, females, wine drinkers & more
34

State of the Industry
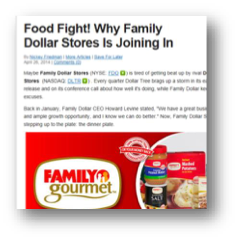
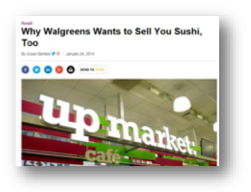
Blurring of Channels
• The expansion of the food department in non-traditional channels has given grocery shoppers considerably more options on when and where they shop.
– Consumers no longer have to rely on local grocery store for fresh & organic
– Non-traditional channels are now stocking up on a large assortment of fresh & convenience foods
– Online retailers give consumers 24/7 access, & brick-and- mortar channels are quickly joining in with delivery or pick-up services, increasing the overall attractiveness of this channel.


35

Specialty Food Companies in Portland
![]()

http://www.dpispecialtyfoods.com/
![]()
http://www.kehe.com/
![]()


https://www.unfi.com/
![]()
http://www.provvista.com/


![]()
http://www.bobsredmill.com/
![]()

Thank You


