I will have a online test on August 2 at 10:00 pm ~ 2:00 am in chicago time
Week 1
Question 1
1 out of 1 points
| Before project work can be controlled, it is critical that the work to be carried out is defined. | |||||||||||
| | | | ||||||||
Question 2
1 out of 1 points
| Project planning and project control are independent and unrelated functions. | |||||||||||
| | | | ||||||||
Question 3
1 out of 1 points
| The key to project performance measurement for project control is measurement and reporting at the work package level. | |||||||||||
| | | | ||||||||
Question 4
1 out of 1 points
| What does "baselining" a projet refer to? | |||||||||||||||
| | | | ||||||||||||
Question 5
1 out of 1 points
| Earned Value Analysis (EVA) is a project control tool that compares actual performance to a combination of a project's planned schedule, planned budget, and planned deliverables. | |||||||||||
| | | | ||||||||
Question 6
1 out of 1 points
| External project control refers to the objective monitoring and corrective actions taken by the project contractor. | |||||||||||
| | | | ||||||||
Question 7
3 out of 3 points
| After the project has been defined, scope change control is a critical part of the overall project control system. Describe the basic elements of the change control process. | |||||||||
| | | | ||||||
Question 8
3 out of 3 points
| Define what Key Performance Indicators (KPIs) are. Explain how KPIs are important to project control. Give an example of a KPI that may be used on a hyptohtical project. | |||||||||
| | | | ||||||
Question 9
3 out of 3 points
| In our readings from Badiru & Kovach (course textbook), the authors present a common framework for a project systems implementation outline Within that framework, they identify three components to "control". What are these 3 components to control, when are they typically conducted, and what are some of the common processes found in each component? | |||||||
| | | | ||||
Week 2
Question 1
1 out of 1 points
|
| What is the total baseline cost of the project? | ||||||||
| | | | ||||||
Question 2
1 out of 1 points
|
| What is the Actual Cost at the end of week 22? | ||||||||
| | | | ||||||
Question 3
1 out of 1 points
|
| What is the BCWP at the end of week 22? | ||||||||
| | | | ||||||
Question 4
1 out of 1 points
|
| What is the BCWS at the end of week 22? | ||||||||
| | | | ||||||
Question 5
1 out of 1 points
|
| What is the project SPI at the end of week 22? What does this SPI tell us? | ||||||||
| | | | ||||||
Question 6
1 out of 1 points
|
| What is the project CPI at the end of week 22? What does these CPI tell us? | ||||||||
| | | | ||||||
Question 7
1 out of 1 points
|
| What is the estimated cost at completion (EAC) for the project? | ||||||||
| | | | ||||||
Question 8
3 out of 3 points
|
| This is a little harder question and requires you to make some "educated guesses" or look up some commentaries about the use of earned value. One of the principle components of the earned value management system is determining how much work has been done - EV. Analyzing work that is physical in nature (building a brick wall) is relatively easy to find what has been accomplished, however, not all project are so "visual". What are three common methods to estimate EV for individual activities in practice? What are the strengths and weakness of each? As a hint, percent of completion is one method. | ||||||
| | | | ||||
Week 3
Question 1
3 out of 3 points
|
| How do CPM and PERT differ? How are they the same? | ||||||||
| | | | ||||||
Question 2
1 out of 1 points
|
| PERT requires three time estimates for every activity. | ||||||||
| | | | ||||||
Question 3
1 out of 1 points
|
| Given the assumptions of PERT, it is possible to determine the probability that a project will be completed by a specified date. | ||||||||
| | | | ||||||
Question 4
1 out of 1 points
|
| In PERT, the mean (expected) time for each activity is determined by using a formula that gives the greatest weight to the “optimistic” time estimate. | ||||||||
| | | | ||||||
Question 5
1 out of 1 points
|
| In PERT (assuming a Beta distribution), if a = 3, m = 5, and b = 6, then: | ||||||||||||||||
| | | | ||||||||||||||
Question 6
4 out of 6 points
|
| Given the following schedule information:
PART 1: Create a PERT schedule. Use the relationships indicated, a start date of 8/8/2016, and the "a", "m", and "b" values given. What is the Expected Finish Date of the Project based upon the PERT calculations? PART 2: Now create a monte-carlo simulation (use 1000 iterations) and uniform distributions for all the activity durations (assume the pessimistic and optimistic durations are the min and max values). The start date should still be 8/8/2016 and the relationships should still be the same. What is the probability that the project will finish before 9/18/2016? P.S. / Hint: Don't forget to make an "END" activity so that you only have to create one output field | | | | |||||||||||||||||||||||||||||||||||||||||||||||||||||||||||
| | | | ||||||||||||||||||||||||||||||||||||||||||||||||||||||||||||
Week 4
Question 1
3 out of 3 points
|
| Your company is beginning to conduct a work sampling study in order to look for ways to improve worker productivity. Management wants you to conduct a statistical analysis using an absolute limit of error (A) of 5% and a confidence interval of 90%. How many observations must you make if the percentage of total work time during which a component occurs is estimated to be 70%? | ||||||||
| | | | ||||||
Question 2
2.5 out of 3 points
|
| Roofers-R-Us wanted to determine the average idle time of its workers on a typical ashpalt shingle project in the residential construction market. The table below shows the data collected. The desired confidence level and relative accuracy were 95.45% and 5%, respectively.
What was the relative accuracy of the collected data? How many more observations are needed to obtain the desired 5% accuracy desired? | | | | ||||||
| | | | |||||||
Question 3
1 out of 1 points
|
| To be statistically acceptable, work sampling should be conducted at percise increments of time (e.g., every three minutes), unbiased, and independent. | ||||||||||
| | | | ||||||||
Question 4
2.5 out of 3 points
|
| This week's readings focus on how to conduct work sampling studies and how to use control charts for performance control. How does work sampling aid in project control/project management? What are the benefits of performance control? Identify three areas where work sampling is most suitable. | ||||||||
| | | | ||||||
Week 5
Quality planning should be done:
before scope definition, scheduling and budgeting of the project
by the project manager just before inspection and testing
to correct for nonconformities
independently by the quality manager but at the same time as scheduling is done by the project manager
as an integrated part of project planning
Inspection and testing is most closely aligned with which one of the following?
Quality planning
Quality assurance
Quality control
Quality of a product implies:
superior reliability and, in the event of a failure, excellent maintainability
proper inspection before the product is shipped
absence of risk that legal action would be taken against the supplier
high cost that is usually reflected in a high selling price
durability of the product, superior style, finish, materials and/or workmanship
none of the above adequately defines the term “quality”
Statistical process control (SPC) is one method to measure process performance as 100% inspection is oftentimes too difficult and/or expensive.
True
False
Which of the following presents information in order of priority to assist focusing on the most critical items first?
Ishikawa diagram
Current reality tree
Pareto diagram
Causal loop diagram
Cause and effect diagram
Part 2: Calculation Problems: Complete the following problems and place your answer/responses within the provided areas below. Points are as indicated.
Problem 6 (5 points):
Read the following article (http://failures.wikispaces.com/Big+Dig+(I+90+Connector+Tunnel) ). With 20-20 hindsight, draw a CE (fishbone, Ishikawa) diagram to illustrate possible causes and effects. The diagram should have been generated before construction of the tunnel, so please include other possible failure modes and other causes you can think of. How would this diagram (developed after the accident) be of value during litigation? You may create your CE diagram in any software program you like (or by hand), but please make sure it is pasted inside this word file for it to be graded.
This is CE diagram for the case

At the point when the diagram was developed, the root causes could be showed at one place. Therefore, the individuals who deal with litigations must ensure that they check thoroughly the key causes of the
failure and arrive to the conclusion on the individual who can be identified as the one answerable to the failure.
Problem 7 (5 points):
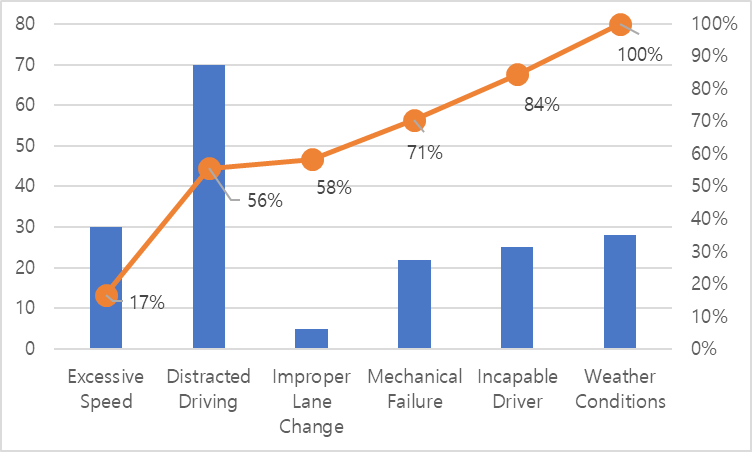
In 2016, over 220 million cars traveled I-44 between Joplin and Springfield. That year there were 180 accidents which resulted in death. The police classified each accident into one of the six categories listed below. Draw a Pareto diagram using the six categories.
| Cause of Accident | Accidents |
| Excessive Speed | 30 |
| Distracted Driving | 70 |
| Improper Lane Change | |
| Mechanical Failure | 22 |
| Incapable Driver | 25 |
| Weather Conditions | 28 |
| Total | 180 |
Here is my Pareto diagram
Problem 8 (5 points):
Consider the 20 samples given below. Part A (2 points) – Determine the control limits for the and R Charts. Part B (3 points) – Plot the and R Charts. What can you conclude about this process?
| Sample # | Sample Observations | ||||
| 36 | 52 | 19 | 47 | 50 | |
| 29 | 21 | 17 | 21 | ||
| 33 | 31 | 26 | 18 | ||
| 40 | 34 | 17 | 27 | 23 | |
| 23 | 41 | 21 | 29 | 20 | |
| 28 | 28 | 35 | 21 | 45 | |
| 32 | 27 | 16 | 30 | 16 | |
| 23 | 29 | 31 | 42 | 13 | |
| 42 | 59 | 38 | 28 | 24 | |
| 10 | 32 | 22 | 22 | 25 | 41 |
| 11 | 38 | 40 | 31 | 48 | 40 |
| 12 | 22 | 52 | 33 | 27 | 37 |
| 13 | 46 | 32 | 20 | 50 | 43 |
| 14 | 27 | 29 | 24 | 15 | 24 |
| 15 | 31 | 34 | 60 | 37 | |
| 16 | 32 | 46 | 30 | 32 | 40 |
| 17 | 35 | 23 | 38 | 46 | 39 |
| 18 | 55 | 25 | 33 | 54 | 41 |
| 19 | 22 | 44 | 51 | 42 | 36 |
| 20 | 14 | 24 | 12 | 33 | 22 |
Insert your answer for problem 8 here.
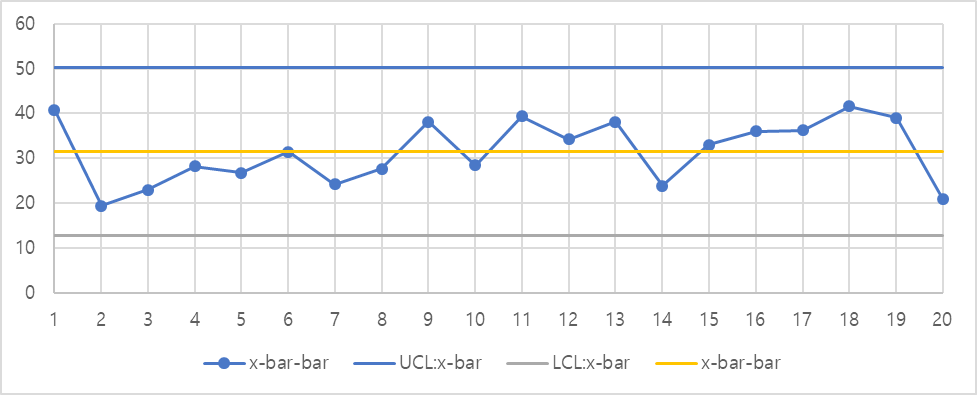
By working on the process, if found Ucl to be 50.24 whereas the Lcl is equal to 12.80. Due to the fact that the data does not vary within the control limits, the process can be described as being stable. In the event that the value of Cp is more than 1.33 then the process can be described as capable. It tells us that the process is complying with our control limits, this is evidenced by the histogram and the normality diagrams in this paper. Therefore given the process has Cp less than 1.33 the process cannot be described as being capable.
Week 6
Question 1
Needs Grading
|
| What aspects of project control fall under contract administration? | ||||||||
| | | | ||||||
Question 2
1 out of 1 points
|
| A Project Management Information System (PMIS) can be as simple as a filing cabinet or even a notebook stored in a project team's common area. | ||||||||||
| | | | ||||||||
Question 3
1 out of 1 points
|
| Which of the following correctly identifies three of the tools and techniques for the Administering Procurements process? | ||||||||||||||
| | | | ||||||||||||
Question 4
0 out of 1 points
|
| Few projects involve contracts or the contracting process. | ||||||||
| | | | ||||||
Question 5
Needs Grading
|
| In contracting out work, does the customer relinquish all control over the project to the contractor? Explain. | ||||||||
| | | | ||||||
Week 7
Kaizen is defined as
|
| Continuous improvement | |
|
| Lean manufacturing | |
|
| Mistake proofing | |
|
| Re-engineering |


1 points
QUESTION 2
A production line uses signs at specific points on the line to indicate when components or raw materials need to be replenished. This practice is an example of:
|
| Poka Yoke | |
|
| FMEA | |
|
| Kaizen | |
|
| Kanban |
1 points
QUESTION 3
Quality function deployment (QFD) is a methodology for
|
| removing bugs from software code | |
|
| a process to map design to key customer requirements/specifications | |
|
| measuring the reliability of a product | |
|
| training employees in quality issues |
1 points
QUESTION 4
For a process at five sigma level, how many opportunities lie outside the specification limits in a production run of one million?
|
| 3.4 | |
|
| 99.9767 | |
|
| 233 | |
|
|
1 points
QUESTION 5
Defects, over-production, inventory, and motion are all examples of:
|
| Waste | |
|
| Noise | |
|
| 5S target areas | |
|
| value-added activities |
1 points
QUESTION 6
Poka Yoke is most closely defined as:
|
| Pace of the work | |
|
| Mistake or error-proofing a process | |
|
| Percent of time spent of business value-added activities | |
|
| Waste |
What are the five (5) S principles and how do they help improve quality and process control?
(5) S Principles are " Seiri, Seiton, Seiso, Seiketsu, and Shitsuke. These will help to organize the workspace with efficiently and effectiveness by identifying and storing the items used. Actually these are implemented from Japanese. Maintaining the area and items and sustaining the new order. The decision making process generally comes from standardization, which builds understanding among the employees of how they work. It also termed as visual control, visual workplace or visual factory. There are several individual uses of principles as follows.
Seiri (sort) Uses : Make work easier by eleminating the difficulties. Reduce chances of being disturbud with unnessasary works. Preventing unnessasary storage. Evaluate nessasary items with cost or factors. Remove all parts or tools that are not in use. Segragate unwanted material from workspace. Sort bad and good things. Waste removal etc.
Seiton (Setting in an order) : Arrange all the items in particular sequence so that a worker and machines can move optimal distance. Decreses the time and hardworking. Who were not fit for the work they will recognize within 50 feet distance. Keeps workplace clean, safe and efficient.
Seiketsu ( Means Standardizing) : Every process has a standard. Gives high standard techniques in the work area. Everything in its right place.
Shitsuke ( Sustain) : It creats an environment where no one should be in harm. Performs regular audits and regular checkups. Training and diciplane here these are goal oriented process. It resulting feedback of nessasary monthly. To maintain proper order. Ensure all defined standards being implemented. Follow regualar process but be implemented and should sustain without yield.
The benefits of 5s are:
It ensures less wastage and improves efficiency.
It ensures reduced space used for storage.
It ensures improved maintenance.
It ensures better and more committed employees.
It ensure improvement in quality.
What does "DMAIC" stand for and what are its major components? How is DMAIC related to project management and in particular project control?
D - Define , M - Measure , A - Analyze , I - Improve , C - Control
Components :
1. Define opportunities
2.Measure performance
3.Analyze opportunity
4.Improve performance
5.Control performance
DMAIC is a data driven quality strategy used to improve process.It is an integral part of six sigma initiative.


