BUSINESS STATISTICS CHART, PROBLEM SOLVING, SHOW ALL WORK
The data in below table lists country code and the order to remittance (OTR) time for hardware / software installations for the last 76 installations (from first to last). OTR is the time it takes from an order being placed until the system is installed and we receive payment (remittance). Because this company does business internationally, it also notes the country of installation using a country code. This code is listed in the first column.
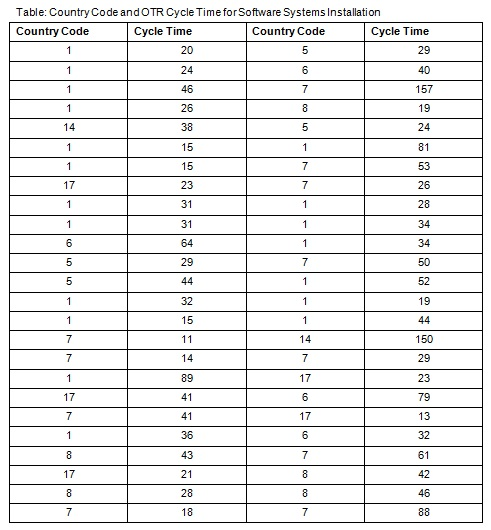
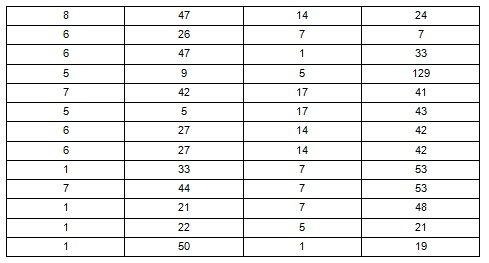
Use the date in table above and answer the following questions in the space provided below:
1.Does the OTR time appear to be stable? Why or why not?
2.If you were to use a control chart to evaluate stability, which chart would you use? Why?
3.What can you learn about the distribution of the installation process?
4.Does it appear that the country has an impact on installation time? Why or why not?
NOTES FROM THE INSTRUCTOR
Class,
As I said, we have a tough job in the second half where you are required to use the statistical formula in all 5 Homeworks and Case Study 2. In particular, you have the Control Charts tool in handling Homework # 5. As I assume that many of you don't have the relevant training like SixSigma or SQC, I provide the following information and instruction of my favorite control chart for you. Of course, you could go your own way with a different control chart. You have 100% freedom. But this is the simplest Control Chart for this particular homework problem #5.
1. Cicle Time Data (I already calculated the Mean and Standard Deviation(STD) of each courtry for you. I think that my numbers are right)
Country Code MEAN STD
1 34 18.63
5 36.25 39.41
6 42.75 19.58
7 46.76 19.58
8 37.5 11.36
14 59.2 51.3
17 29.29 12.08
2. Find the average of the means and the average of the SDTs (this is your job).
3. Find the Upper Control Limit(UCL) and Lower Control Limit(LCL) using the formula below:
UCL = Average of the means + 3 times (Average of the SDTs)
LCL = Average of the means - 3 times (Average of the SDTs)
4. Outlier Identification and Conclusion
If you find any data value (from 76 data of cycle time from 7 countries) outside of the acceptable range (between LCL and UCL), that is an outlier. It may be one or two or more. It doesn't matter. If there exists any oulier, the process is unstable.
You must present all the necessary calculation details above and then answer the four questions based on your idea and personal opinion.
Another option or alternative to the classical SQC method is the use of Median player called Box-Whisker's Plot. But it is a little more work as I showed in my email earlier.
If you include some graphs showing UCL and LCL in your paper using Excel, it would be fantastic. Thank you for your great work.
Dr.Kim


