paper
Sampling
The Purpose of Sampling
Sampling Terminology
Populations and Samples
Sampling Frames
A Classic Sampling Disaster
Probability Samples
Simple Random Sampling
Systematic Sampling
Stratified Sampling
Area Sampling
Estimating Sample Size
Nonprobability Samples
Availability Sampling
Snowball Sampling
Quota Sampling
Purposive Sampling
Dimensional Sampling
Sampling with Minority Populations
A Note on Sampling in Practice
Review and Critical Thinking
Main Points
Important Terms for Review
Critical Thinking
Exploring the Internet
For Further Reading
Exercises for Class Discussion
A number of correctional systems have established programs that use behavior modification techniques to shape inmate behavior by rewarding sought-after behavior and withholding privileges from those who are recalcitrant or hostile. Each inmate who is placed in such a program becomes, in a sense, a test of the hypotheses about behavior change derived from behavioral theory. What can we conclude, however, if one inmate’s behavior changes in a way that supports these hypotheses? Will the program work with other inmates?
This is the issue at the core of this chapter. Can knowledge gained from one or a few cases be considered knowledge about a whole group of people? The answer depends on whether the inmate is representative of some larger group of which the inmate is a “sample.” Does he or she represent all inmates? Only inmates in a particular prison? Just inmates who have committed certain offenses? Or is this inmate not representative of any larger group? These issues are at the center of the problem of sampling, or selecting a few cases out of some larger grouping for study. All of us have had experience with sampling. Cautiously tasting a spoonful of soup is a process of sampling to see how hot it is; taking a bite of a new brand of pizza is a process of sampling to see if we like it. All sampling involves attempting to make a judgment about a whole something—a bowl of soup, a brand of pizza, or an inmate population—based on an analysis of only a part of that whole. Scientific sampling, however, is considerably more careful and systematic than casual, everyday sampling. In this chapter, we discuss the fundamentals of sampling along with the benefits and disadvantages of various sampling techniques.
The Purpose of Sampling
When we first encounter the subject of sampling, a common question is this: Why bother? Why not just study the whole group? A major reason for studying samples rather than whole groups is that the whole group sometimes is so large that studying it is not feasible. For example, human service workers might want to learn about welfare recipients, the mentally ill, prison inmates, or some other large group of people. It would be difficult—and often impossible—to study all members of these groups. Sampling, however, allows us to study a workable number of cases from the large group to derive findings that are relevant to all members of the group.
A second reason for sampling is that, surprising as it may seem, we can get better information from carefully drawn samples than we can from an entire group. This is especially true when the group under study is extremely large. For example, the United States takes a census of all residents at the beginning of each decade. Despite the vast resources that the federal government puts into the census, substantial undercounts and other errors occur. In fact, after recent censuses, numerous cities filed lawsuits complaining of alleged undercounts. Between the decennial censuses, the U.S. Census Bureau conducts sample surveys to update population statistics and collect data on other matters. The quality of the data gathered in these sample surveys actually is superior to the data in the census itself. The reason is that, with only a few thousand people to contact, the task is more manageable, involving better-trained interviewers, greater control over the interviewers, and fewer hard-to-find respondents. In fact, the U.S. Census Bureau even conducts a sample survey after each census as a check on the accuracy of that census. Indeed, were it not a constitutional requirement, the complete census might well be dropped and replaced by sample surveys.
Much research, then, is based on samples of people. Samples make possible a glimpse of the behavior and attitudes of whole groups of people, and the validity and accuracy of research results depend heavily on how samples are drawn. An improperly drawn sample renders the collected data virtually useless. So, an important consideration regarding samples is how representativethey are of the population from which we draw them. A representative sample is one that accurately reflects the distribution of relevant variables in the target population. In a sense, the sample should be considered a small reproduction of the population. Imagine, for example, that a researcher wants to study the success of unmarried teenage mothers in raising their children, with the goal of improving the provision of services to these adolescents. The research sample should reflect the relevant characteristics of unmarried teenage mothers in the community. Such characteristics might include age, years of education, and socioeconomic status. To be representative, the sample would have to contain the same proportion of unmarried teenage mothers at each age level, each educational level, and each socioeconomic status that exists in the community as a whole. In short, a representative sample should have all the same characteristics as the population. The representative character of samples allows the conclusions that are based on them to be legitimately generalized to the populations from which they are drawn. As we will see later in this chapter, nonrepresentative samples are useful for some research purposes, but researchers must always assess the representativeness of their samples to make accurate conclusions. Before comparing the various techniques for drawing samples, we will define some of the major terms that are used in the field of sampling.
Sampling Terminology
Populations and Samples
A sample is drawn from a population, which refers to all possible cases of what we are interested in studying. In the human services, the target population often is people who have some particular characteristic in common, such as all Americans, all eligible voters, all school-age children, and so on. A population need not, however, be composed of people. Recall from Chapter 4that the unit of analysis can be something other than individuals, such as groups or programs. Then, the target population is all possible cases of our unit of analysis. A sample consists of one or more elements selected from a population. The manner in which we select elements for the sample has enormous implications for the scientific utility of the research based on that sample. To select a good sample, we need to clearly define the population from which to draw the sample. Failure to do so can make generalizing from the sample observations highly ambiguous and result in inaccurate conclusions.
The definition of a population should specify four things: (1) content, (2) units, (3) extent, and (4) time (Kish 1965, p. 7). Consider the sample that James Greenley and Richard Schoenherr (1981) used to study the effects of agency characteristics on the delivery of social services. First, the content of the population refers to the particular characteristic that the members of the population have in common. For Greenley and Schoenherr, the characteristic that was common to the members of their population was that they were health or social service agencies. Second, the unit indicates the unit of analysis, which in our illustration is organizations rather than individuals or groups. (Although Greenley and Schoenherr collected data from practitioners and clients in the organizations, their focus was on comparing the performance of agencies.) Third, the extent of the population refers to its spatial or geographic coverage. For practical reasons, Greenley and Schoenherr limited the extent of their population to health and social agencies serving one county in Wisconsin. It was not financially feasible for them to define the extent of their population as all agencies in Wisconsin—or in the United States. Finally, the time factor refers to the temporal period during which a unit must possess the appropriate characteristic to qualify for the sample. Greenley and Schoenherr conducted a cross-sectional study, and only agencies that were in operation at the time those authors collected their data qualified. A longitudinal study might include agencies that came into existence during the course of the study.
With these four factors clearly defined, a population normally is adequately delimited. Then, we can construct what is called a sampling frame.
Sampling Frames
A sampling frame is a listing of all the elements in a population. In many studies, we draw the actual sample from this listing. The adequacy of the sampling frame is crucial in determining the quality of the sample, and the degree to which the sampling frame includes all members of the population is of major importance. Although an endless number of possible sampling frames exist, a few illustrations will describe some of the intricacies of developing good sampling frames.
In human service research, some of the most adequate sampling frames consist of lists of members of organizations. For example, if we wanted to expand the study, mentioned at the beginning of this chapter, regarding the impact of behavior modification on inmates, we could draw a larger sample of inmates in that prison using a straightforward sampling frame consisting of all inmates currently listed as residents of that institution. Given the care with which correctional facilities maintain accurate records of inmates, this sampling frame undoubtedly would be complete and accurate. Other examples of sampling frames based on organizational affiliation would be the membership rosters of professional groups, such as the National Association of Social Workers (NASW), the American Psychological Association, or the American Society of Criminology. These lists are not quite as accurate as an inmate roster, because people who have very recently joined the organization might not appear on the official lists. Clerical errors also might lead to a few missing names. These errors, however, would have little effect on the adequacy of the sampling frame.
When using organizational lists as a sampling frame, we must exercise caution about what we define as the population and about whom we make generalizations. The population consists of the sampling frame, and we can make legitimate generalizations only about the sampling frame. Many social workers, for example, do not belong to the NASW. Thus, a sample taken from the NASW membership roster represents only NASW members and not all social workers. When using organizational lists as sampling frames, then, it is important to assess carefully who the list includes and who the list excludes. Sometimes, research focuses on a theoretical concept that is operationalized in terms of an organizational list that does not include all actual instances of what the concept intends. For example, a study of poverty could operationalize the concept “poor” as those receiving some form of public assistance. Yet, many people with little or no income do not receive public assistance. In this case, the sampling frame would not completely reflect the population that the theoretical concept intended.
Some research focuses on populations that are quite large, such as residents of a city or a state. To develop sampling frames for household-based surveys of these populations, five listings could be considered: (1) telephone numbers, (2) post office address listings, (3) listings developed by survey research organizations, (4) utility subscribers, or (5) city directories. A listing of telephone numbers in a geographic area can be considered a sampling frame of households, although there are a number of problems with such a listing. Even today, some people do not have telephone service (about 7 percent of households) (U.S. Census Bureau 2008). Those without telephones tend to be concentrated among the poor, living in rural areas, and transient groups, such as the young. For a research project in which these groups are important, sampling based on telephone numbers could be very unrepresentative. Another problem is the growth in use of cell phones, with as many as 8 to 12 percent of households today having cell-phone service only (Keeter et al. 2007). Cell phones are not as clearly tied to a particular household or geographic area as traditional landlines are. So, a person may live in a different geographic area from where the cell phone is registered. This makes it difficult to know what phone numbers are to be included in a sampling frame when selecting a random sample of households for a particular community. If cell phones are left out, it threatens the representativeness of the sample, because cell phone-only people tend to be younger, less affluent, and more transient. Telephone books do not provide a very good listing of telephone numbers because of the many unlisted numbers and cell phones that are not listed in phone books. Instead, if telephone numbers are to be used as a sampling frame, some random number selection technique, such as random-digit dialing (RDD), can ensure that every household with telephone service has a chance of appearing in the sample. Of course, RDD does nothing about non-coverage resulting from the lack of telephone service in some households or some of the problems created by cell phones.
Another population listing that can serve as a sampling frame for a particular geographic area is a listing provided by the U.S. Postal Service of all residential addresses that it serves in an area (O’Muircheartaigh, Eckman, and Weiss 2002). These listings can be purchased from direct mail marketers, but they also have problems of noncoverage: Households can request that their address not be sold by the post office, and many rural addresses don’t show up on the listing.
A third source of household listings are those developed by some survey research organizations by having trained people walk through a community, physically locate every housing unit, and note its address. This probably is the most complete listing of households in a community, but it is also expensive—either to purchase or to develop yourself.
Another household listing sometimes used for sampling is a list of customers from a local electric utility. Although some households do not have telephone service, relatively few lack electricity, and the problem of noncoverage therefore is less significant. A major problem, however, comes from multiple-family dwellings, which often list utilities only in the name of the building’s owner rather than in the names of all the individual residents. The young, the old, and the unmarried are more likely to inhabit these multiple-family dwellings. Unless we supplement the utility listings, samples will systematically underrepresent people in these groups. Visiting the dwellings and adding the residents to the list of utility subscribers can overcome this problem, but this is a time-consuming task.
Finally, city directories are quite useful as household listings. Available in most libraries, city directories contain, among other things, an alphabetical listing of streets and addresses with residents’ names. This listing is fairly accurate, but it does exclude new construction.
A Classic Sampling Disaster
Some disastrous mistakes have occurred during sampling in past investigations, often because of inadequate sampling frames. These mistakes result in special chagrin when the investigator makes some precise—and easily refutable—predictions based on the sample. A classic example of this was the attempt Literary Digest magazine made to predict the outcome of the 1936 presidential race between Alfred Landon and Franklin Roosevelt. When predicting an election, the target population is all likely voters. Literary Digest, however, did not use a sampling frame that listed all likely voters. Rather, they drew their sample from lists of automobile owners and from telephone directories. On the basis of their sample results, they predicted that Landon would win by a substantial margin, but of course, Roosevelt won the election easily. Why the error in prediction? This question continues to generate debate in the professional literature, but the evidence points toward two possible factors, each serious in itself but deadly in combination (Bryson 1976; Cahalan 1989; Squire 1988). The first problem was a flawed sampling frame. In 1936, with the Great Depression at its peak, a substantial proportion of eligible voters, especially poorer ones, did not own cars or have telephones. In short, the sample was drawn from an inadequate sampling frame and did not represent the target population. In addition, because the poor are more likely to vote Democratic, most of the eligible voters excluded from the sampling frame voted for the Democratic candidate, Roosevelt. The second problem in the Literary Digest poll was a poor response rate. Although it employed a massive sample size, the pollsters used a mailed survey, and the percentage of respondents who returned the surveys was very low (about 23 percent). An independent follow-up investigation in a city where half the voters voted for Roosevelt and half for Landon found that only 15 percent of the Roosevelt supporters returned their surveys but that 33 percent of the Landon supporters did (Cahalan 1989). So, if a bias existed in the sampling frame against Roosevelt supporters, the nonresponse bias compounded it: Landon supporters were much more likely to return their surveys to Literary Digest. The result was the magazine’s embarrassingly inaccurate prediction. Although Literary Digest was a popular and respected magazine before the election, it never recovered from its prediction and went out of business a short time later.
We can construct adequate sampling frames for many human service projects from existing listings, such as those already mentioned, which are already available or readily made. Still, we must exercise caution in using such lists, because they may inadvertently exclude some people. In fact, human service research is especially vulnerable to this, because we often study populations that are difficult to enumerate. For example, undocumented aliens are, by definition, not listed anywhere. We know they make up a large segment of the population in such urban centers as Los Angeles, but a study of the poor in these areas that relied on a city directory obviously would miss large numbers of such people. Early studies of gay men also fell prey to this problem (Bell and Weinberg 1978; Hooker 1957). In some of these studies, the sampling frame was homosexuals who were listed as patients by psychotherapists who participated in the research. The studies concluded that homosexuality was associated with personality disturbance. Yet, it does not take great insight to recognize that the sampling frames did not list many gay men—namely, those feeling no need to see therapists—and, thus, were strongly biased toward finding personality disorders among gays.
We must assess sampling frames carefully to ensure that they include all elements of the population of interest. The remainder of this chapter is a discussion of the different ways in which to select samples. First, we discuss probability samples, for which we are most likely to have a sampling frame from which to draw the sample. Researchers use probability samples in some types of human service research, such as needs assessment and evaluation research. Then, we discuss nonprobability samples, which researchers use in assessing client functioning and in evaluating the effectiveness of intervention strategies.
Probability Samples
With luck, almost any sampling procedure could produce a representative sample, but that is little comfort to the researcher who wants to be as certain as possible that his or her sample is representative. Techniques that make use of probability theory can both greatly reduce the chances of getting a nonrepresentative sample and, more importantly, permit the researcher to estimate precisely the likelihood that a sample differs from the true population by a given amount. In these samples, known as probability samples, each element in the population has some chance of inclusion in the sample, and the investigator can determine the chances or probability of each element’s inclusion (Scheaffer, Mendenhall, and Ott 2006). In their simpler versions, probability sampling techniques ensure that each element has an equal chance of inclusion. In more elaborate versions, the researcher takes advantage of knowledge about the population to select elements with differing probabilities. The key point is that, whether the probabilities are equal or different, each element’s probability of inclusion in a probability sample is nonzero and known. Furthermore, probability sampling enables us to calculate sampling error, which is an estimate of the extent to which the values of the sample differ from those of the population from which it was drawn.
Simple Random Sampling
The simplest technique for drawing probability samples is simple random sampling (SRS), in which each element in the population has an equal probability of inclusion in the sample. Simple random sampling treats the target population as a unitary whole. We might begin with a sampling frame containing a list of the entire population—or as complete a list as we can obtain. We would then number the elements in the sampling frame sequentially and select elements from the list using a procedure known to be random. If we computerized the sampling frame, we could accomplish random selection merely by programming the computer to select randomly a sample of whatever size we desired. (Appendix B describes how to generate random samples both with the computer and by hand, using a table of random numbers.)
Although simple random samples have the desirable feature of giving each element in the sampling frame an equal chance of appearing in the sample, SRS often is impractical. A major reason for this is cost. Imagine doing a research project that calls for a national sample of 2,000 households. Even if one could obtain such a sample using SRS, which is unlikely, it would be prohibitively expensive to send interviewers all over the country to obtain the data. Furthermore, alternatives to SRS might be more efficient in terms of providing a high degree of representativeness with a smaller sample. Normally, SRS is limited to fairly small-scale projects that deal with populations of modest size for which we can obtain adequate sampling frames. The importance of SRS lies not in its wide application. Rather, SRS is the basic sampling procedure on which statistical theory is based, and it is the standard against which other sampling procedures are measured.
Systematic Sampling
A variation on SRS is called systematic sampling, which involves taking every kth element listed in a sampling frame. Systematic sampling uses the table of random numbers to determine a random starting point in the sampling frame. From that random start, we select every k th element into the sample. The value of k is called the sampling interval, and it is determined by dividing the population size by the desired sample size. For example, if we wanted a sample of 100 from a population of 1,000, then the sampling interval would be 10. From the random starting point, we would select every 10th element from the sampling frame for the sample. If the starting point is in the middle of the list, then we proceed to the end, jump to the beginning, and end up at the middle again.
In actual practice, dividing the population by the sample size usually does not produce a whole number, so the decimal is rounded upward to the next-largest whole number. This provides a sampling interval that takes us completely through the sampling frame. If we round downward, then the sampling interval becomes slightly too narrow, and we reach the desired sample size before we exhaust the sampling frame, which would mean that those elements farthest from the starting point have no chance of selection.
We commonly use systematic sampling when we draw samples by hand rather than by computer. The only advantage of systematic sampling over SRS is in clerical efficiency. In SRS, the random numbers will select elements scattered throughout the sampling frame. It is time-consuming to search all over the sampling frame to identify the elements that correspond with the random numbers. In systematic sampling, we proceed in an orderly fashion through the sampling frame from the random starting point.
Unfortunately, systematic sampling can produce biased samples, although this is rare. The difficulty occurs when the sampling frame consists of a population list that has a cyclical or recurring pattern, called periodicity. If the sampling interval happens to be the same as that of the cycle in the list, then it is possible to draw a seriously biased sample. For example, suppose we were sampling households in a large apartment building. The apartments are listed in the sampling frame by floor and apartment number (2A, 2B, 2C, 2D, 2E, 2F, 3A, 3B, and so on). Furthermore, suppose that, on each floor, apartment F is a corner apartment with an extra bedroom and correspondingly higher rent than the other apartments on that floor. If we had a sampling interval of three and randomly chose to begin counting with apartment 2D, then every F apartment would appear in the sample, which would bias the sample in favor of the more expensive apartments and, thus, in favor of the more affluent residents of the apartment building. So, when we use systematic sampling techniques, we need to assess the sampling frame carefully for any cyclical pattern that might confound the sample and, if necessary, rearrange the list to eliminate the pattern. Or, we could use SRS instead of systematic sampling.
Stratified Sampling
With SRS and systematic sampling methods, we treat the target population as a unitary whole when sampling from it. Stratified sampling changes this by dividing the population into smaller subgroups, called strata, before drawing the sample and then drawing separate random samples from each of the strata.
Reduction in Sampling Error
One of the major reasons for using a stratified sample is that stratifying reduces sampling error for a given sample size to a level lower than that of an SRS of the same size. This is so because of a very simple principle: The more homogeneous a population on the variables under study, the smaller the sample size needed to represent it accurately. Stratifying makes each sub-sample more homogeneous by eliminating the variation on the variable used for stratifying. Perhaps a gastronomic example will help illustrate this point. Imagine two large, commercial-size cans of nuts, one labeled “peanuts” and the other labeled “mixed nuts.” Because the can of peanuts is highly homogeneous, only a small handful from it gives a fairly accurate indication of the remainder of its contents. The can of mixed nuts, however, is quite heterogeneous, containing several kinds of nuts in different proportions. A small handful of nuts from the top of the can cannot be relied on to represent the contents of the entire can. If the mixed nuts were stratified by type into homogeneous piles, however, then a few nuts from each pile could constitute a representative sample of the entire can.
Although stratifying does reduce sampling error, it is important to recognize that the effects are modest. We expect approximately 10 to 20 percent (or less) reduction in comparison to an SRS of equal size (Henry 1990; Sudman 1976). Essentially, the decision to stratify depends on two issues: the difficulty of stratifying, and the cost of each additional element in the sample. It can be difficult to stratify a sample on a particular variable if it is hard to get access to data on that variable. For example, we would find it relatively easy to stratify a sample of university students according to class level, because universities typically include class status as part of a database of all registered students. In contrast, we would find it difficult to stratify that same sample on the basis of whether the students had been victims of sexual abuse during childhood, because these data are not readily available and getting them would require a major study in itself. So, stratification requires either that the sampling frame include information on the stratification variable or that the stratification variable is easily determined. Telephone surveys and stratification of respondents by gender illustrate the latter situation. Telephone interviewers can simply ask to speak to the man of the house to obtain the male stratum and request to speak to the woman of the house for the female stratum. If no one of the desired gender is available, then the interviewer drops that household and substitutes another. The process may require some extra phone calls, but the time and cost of doing this can pay for itself in the quality of the sample. As for the effect of cost issues on the decision of whether to stratify, if the cost of obtaining data on each case is high, as in an interview survey, then stratifying to minimize sample size probably is warranted. If each case is inexpensive, however, then stratifying to reduce cost may not be worth the effort unless it can be easily accomplished.
Proportionate Sampling
When we use stratification to reduce sampling error, we normally use proportionate stratified sampling, in which the size of the sample taken from each stratum is proportionate to the stratum’s presence in the population. Consider a sample of the undergraduates at a college or university. Although the students differ on many characteristics, an obvious difference is their class standing. Any representative sample of the student body should reflect the relative proportions of the various classes as they exist at the college as a whole. If we drew an SRS, then the sample size would have to be quite large for the sample to reflect accurately the distribution of class levels. Small samples would have a greater likelihood of being disproportionate. If we stratify on class level, however, then we can easily make the sample match the actual class distribution, regardless of the sample size. Table 6.1 contains the hypothetical class distribution of a university student body. If a researcher wanted a sample of 200 students with these proportions of students accurately represented, stratifying could easily accomplish it. The researcher would begin by developing a sampling frame with the students grouped according to class level, then would draw a separate SRS from each of the four class strata in numbers proportionate to their presence in the population: 70 freshmen, 50 sophomores, 40 juniors, and 40 seniors.
Table 6.1 Hypothetical Proportionate Stratified Sample of University Students
| Proportion in University |
| Stratified Sample of 200 |
|
| Seniors | 20% | Seniors | 40 |
| Juniors | 20% | Juniors | 40 |
| Sophomores | 25% | Sophomores | 50 |
| Freshmen | 35% | Freshmen | 70 |
|
| 100% |
| 200 |
In actual practice, it is normal to stratify on more than one variable. In the case of a student population, for example, the researcher might want to stratify on sex as well as class level. That would double the number of separate subsamples from four to eight: senior men, senior women, junior men, and so on. Even though stratifying on appropriate variables always improves a sample, researchers should use stratification judiciously. Stratifying on a few variables provides nearly as much benefit as stratifying on many. Because the number of subsamples increases geometrically as the number of stratified variables and the number of categories increase, attempting to stratify on too many variables can excessively complicate sampling without offering substantially increased benefits in terms of a reduction in sampling error.
Disproportionate Sampling
In addition to reducing error, we use stratified samples to enable comparisons among various subgroups in a population when one or more of the subgroups is relatively uncommon. For example, suppose we were interested in comparing two-parent families receiving welfare with other families receiving welfare. If two-parent families make up only about 2 percent of families on the welfare rolls, then a large SRS of 500 welfare families would be expected to contain only 10 such families. This number is far too small to make meaningful statistical comparisons. Stratifying in this case allows us to draw a larger sample of two-parent families to provide enough cases for reliable comparisons to be made. This is called disproportionate stratified sampling, because we do not sample the strata proportionately to their presence in the population. This type of sample is different from most probability samples, where we achieve representativeness by giving every element in the population an equal chance of appearing in the sample. With a disproportionate stratified sample, each element of a stratum has an equal chance of appearing in the sample of that stratum, but the elements in some strata have a better chance of appearing in the overall sample than the elements of other strata do.
Selection of variables on which to stratify depends on the reason for stratifying. If we were stratifying to ensure sufficient numbers of cases for analysis in all groups of interest, as in the example of two-parent welfare families, then we would stratify on the variable that has a category with a small proportion of cases in it. This often is an independent variable and involves disproportionate stratified sampling. On the other hand, if the goal of stratifying is to reduce sampling error, as is the case in proportionate stratified sampling, then we might use variables other than the independent variable. Stratifying has an effect in reducing sampling error only when the stratification variables relate to the dependent variables under study. So, we should select variables that we know or suspect of having an impact on the dependent variables. For example, a study concerning the impact of religiosity on delinquency might stratify on socioeconomic status, because studies have shown that this variable is related to delinquency involvement. Stratifying on a frivolous variable, such as eye color, would gain us nothing, because it is unlikely to relate to delinquency involvement. It is worth noting, however, that stratifying never hurts a sample. The worst that can happen is that the stratified sample will have about the same sampling error as an SRS of equivalent size, and that the stratifying efforts will have gone for naught. Research in Practice 6.1 illustrates a fairly complex use of a stratified sample.
Area Sampling
Area sampling (also called cluster sampling or multistage sampling) is a procedure in which we obtain the final units to include in the sample by first sampling among larger units, called clusters, that contain the smaller sampling units. A series of sampling stages are involved, working down in scale from larger clusters to smaller ones.
Research in Practice 6.1: Program Evaluation: Sampling for Direct Observation of Seat Belt Use
To encourage people to use seat belts, many states have passed legislation requiring the use of seat belts by drivers and passengers. Do these laws work? Do people wear their seat belts in states that require them? Trying to answer this question through the use of a survey probably would not produce very accurate results. Many people are likely to give the socially desirable response and claim on a survey that they use their seat belts when they actually don’t. Faced with the undesirability of a survey, researchers at the University of Michigan Transportation Research Institute turned to direct observation of drivers and passengers to accurately determine levels of seat belt use (Wagenaar and Wiviott 1986). Direct observation, however, had its own problems. Early on, the researchers determined that to reliably code the desired information about each vehicle, the vehicle had to be stopped at least briefly. This requirement greatly affected both the sampling and the observation procedures.
Because the main purpose of the study was to estimate seat belt use rates for the state of Michigan, a representative sample was crucial. Given the requirements for observation, the researchers needed a representative sample of places where vehicles temporarily stopped. They solved this unique sampling problem by selecting a sample of intersections with automatic traffic signals. The signals held the traffic long enough for accurate observations and in places with sufficient traffic to keep the observers efficiently busy. Specifically, using a multistaged stratified probability sampling procedure, the researchers selected 240 intersections. First, they identified all counties in Michigan with at least three intersections controlled by electronic signals. They also discovered that 20 of Michigan’s 83 counties did not meet this criterion, so those were grouped with adjacent counties to form 63 counties or county groups.
The 63 areas were then grouped into seven regions, which became strata for a stratified sample, with a separate sample drawn from each region. Given the great differences in population density, from high in the southeastern part of the state to very low in the northern and northwestern parts, the researchers drew a disproportionate sample to ensure some inclusion of the low-population-density areas. This was important, because they hypothesized that population density could relate to seat belt use rates. The counties and county groups in the seven regions constituted the primary sampling units (PSUs). The researchers selected 60 PSUs by using a weighting system such that the most populous counties (or county groups) had the highest probability of inclusion in the sample. In some cases, large population resulted in multiple PSUs being selected from the same county. For example Wayne County, which includes the city of Detroit, had 13 PSUs selected. This step narrowed the sample down to 32 counties or county groups that were representative of the state population.
For the next stage, the researchers selected a complete list of all intersections equipped with electronic signals in the selected counties and county groups to serve as a sampling frame. From this sampling frame, they randomly selected the final sample of intersections, for a total of 240 observation sites.
The study concluded that the legislation had the desired effect. The proportion of people using seat belts tripled after the legislation was passed. The effect did wear off somewhat over time, but a few years after the laws were passed, seat belt usage was still well over twice as high as it was before the legislation.
For example, imagine that we wanted to conduct a needs assessment survey that would determine the extent and distribution of preschool children with educational deficiencies in a large urban area. Simple random and systematic samples are out of the question, because no sampling frame listing all such children exists. We could, however, turn to area sampling, a technique that enables us to draw a probability sample without having a complete list of all elements in the population. The ultimate unit of analysis in this needs assessment would be households, because children live in households and we can create a sampling frame of households. We get there in the following way (see Figure 6.1). First, we take a simple random sample from among all census tracts in the urban area. (The U.S. Census Bureau divides urban areas into a number of census tracts, which are areas of approximately 4,000 people.) At the second stage, we list all the city blocks in each census tract in our sample, and then we select a simple random sample from among those city blocks. In the final stage, we list the households on each city block in our sample, and then we select a simple random sample of households on that list. With this procedure, we have an “area probability sample” of households in that urban area. (Public opinion polling agencies, such as Roper, typically use area sampling or a variant of it.) Finally, we interview each household in the sample regarding educational deficiencies among children in that household. If we were sampling an entire state or the whole country, then we would include even more stages of sampling, starting with even larger areas, but eventually working down to the household or individual level, whichever is our unit of analysis.
Figure 6.1 Drawing an Area Probability Sample
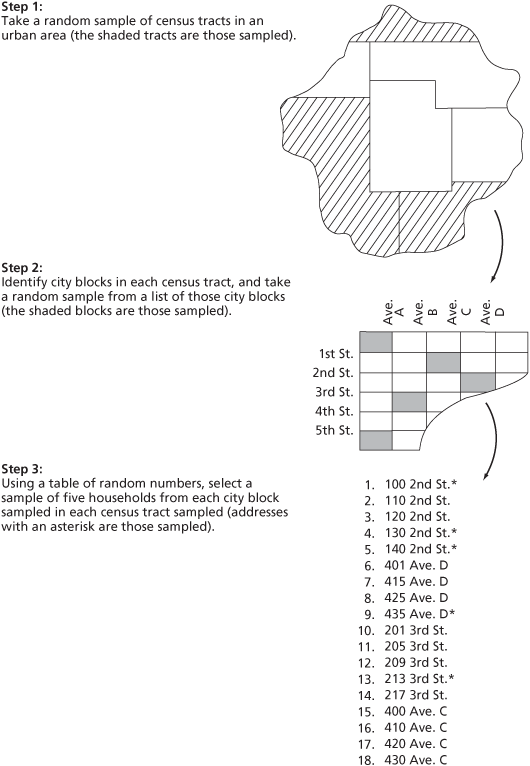
A number of factors can complicate area sampling. For example, selected blocks within an area often contain vastly different numbers of people—from high-density inner-city areas to the lower-density suburbs. We must adjust the number of blocks and the number of households per block that are selected into the sample to take into account the differing population densities. Another complication involves the estimation of sampling error. Fairly straightforward formulas for estimating sampling error exist for the simpler sampling techniques. With area sampling, however, the many stages of sampling involved make error estimation exceedingly complex (Kish 1965; Scheaffer, Mendenhall, and Ott 2006).
Error estimation is quite important for area samples. These samples are subject to greater error than other probability samples, because some error is introduced at each stage of sampling: The more stages involved, the more the sampling error accumulates. Other factors affecting sampling error are the size of the areas initially selected and their degree of homogeneity: The larger the initial areas and the greater their homogeneity, the greater the sampling error. This may seem odd, because with stratified sampling, greater homogeneity leads to less error. Remember, however, that with stratified sampling, we select a sample fromeach stratum, but with area sampling, we draw samples only from a few areas. If the few areas in a sample are homogeneous in comparison with the others, then they are less representative. Small, more numerous, heterogeneous clusters lead to more representative area samples. Despite the complexity, area sampling allows us to draw highly accurate probability samples from populations that, because of their size or geographical spread, we could not otherwise sample.
Estimating Sample Size
As we have seen, a key issue in selecting a sample is that it represent the population from which it was drawn. People sometimes assume that a larger sample is more representative than a smaller one and, thus, that one should go for the largest sample possible. Actually, however, deciding on an appropriate sample size is far more complicated. Five factors influence the sample size: (1) research hypotheses, (2) precision, (3) population homogeneity, (4) sampling fraction, and (5) sampling technique.
Research Hypotheses
One concern in establishing the desired sample size is that we have a sufficient number of cases with which to examine our research hypotheses. Consider a hypothetical study with three variables containing three values each. For an adequate test of the hypotheses, we need a cross tabulation of these three variables, and this would require a 3 × 3 × 3 table, or a table with 27 cells. If our sample were small, then many cells would have few or no cases in them, and we could not test the hypotheses. Johann Galtung (1967, p. 60) has suggested that 10 to 20 cases in each cell provides an adequate test of hypotheses. We might use disproportionate stratified sampling here to ensure an adequate number of cases in each cell. When that is not possible, Galtung suggests the following formula to determine sample size:
rn × 20 = sample size
where r refers to the number of values on each variable and n refers to the number of variables. Thus, for our hypothetical study,
rn × 20 = 33 × 20 = 27 × 20 = 540
So, we would need a sample size of 540 to feel reasonably assured that we had a sufficient number of cases in each cell. The formula works only if, as in our example, all variables have the same number of values. Furthermore, this technique does not guarantee an adequate number of cases in each cell. If some combination of variables is rare in the population, we may still find few cases in our sample.
Researchers often use statistical procedures in testing hypotheses, and most such procedures require some minimum number of cases to provide accurate results. What is the smallest legitimate sample size? This depends, of course, on the number of variables and on the values they can take. Generally, however, 30 cases is considered to be the bare minimum, and some researchers conservatively set 100 as the smallest legitimate sample size (Bailey 1987; Champion 1981). Anything smaller begins to raise questions about whether researchers can properly apply statistical procedures.
Precision
Another factor influencing sample size is the level of precision, or the amount of sampling error, that a researcher is willing to accept. Recall that sampling error refers to the difference between a sample value of some variable and the population value of the same variable. Suppose that the average age of all teenagers in a city is 15.4 years. If we draw a sample of 200 teenagers and calculate an average age of 15.1 years, then our sample statistic is close to the population value, but there is an error of 0.3 years. Remember, however, that the ultimate reason for collecting data from samples is to draw conclusions regarding the population from which we drew those samples. We have data from a sample, such as the average age of a group of teenagers, but we do not have those same data for the population as a whole. If we did, we would not need to study the sample, because we already would know what we want to know about the population.
If we do not know what the population value is, how can we assess the difference between our sample value and the population value? We do it in terms of the likelihood, or probability, that our sample value differs by a certain amount from the population value. (Probability theory is discussed in more detail in Chapter 15.) So, we establish a confidence interval, or a range in which we are fairly certain the population value lies. If we draw a sample with a mean age of 15.1 years and establish a confidence interval of ± (plus or minus) 1.2 years, then we are fairly certain that the mean age in the population is between 13.9 and 16.3 years of age. Probability theory also enables us to be precise about how certain we are. For example, we might be 95 percent certain, which is called the confidence level. (The computation of confidence intervals and confidence levels is beyond the intent of this book.) Technically, this means that if we draw a large number of random samples from our population and compute a mean age for each of those samples, then 95 percent of those means would have confidence intervals that include the population mean and 5 percent would not. What is the actual population mean? We don’t know, because we have not collected data from the whole population. We have data from only one sample, but we can conclude that we are 95 percent sure that the population mean lies within the confidence interval of that sample.
Precision is directly related to sample size: Larger samples are more precise than smaller ones. Thus, probability theory enables us to calculate the sample size that is required to achieve a given level of precision. Table 6.2 does this for simple random samples taken from populations of various sizes. As an example of how to read the table, a sample size of 1,023 would give you a 95 percent chance to obtain a sampling error of 3 percent or less with a population of 25,000 elements and a relatively heterogeneous population (a 50/50 split identifies a heterogeneous population, and an 80/20 split is a homogeneous population). In other words, a 95 percent chance exists that the population value is within 3 percent of the sample estimate. Again, to be technical, it means that if we draw many random samples and determine a confidence interval of 3 percent for each, then 95 percent of those confidence intervals will include the population value. Table 6.2 shows that sample size must increase when, other things being equal, the researcher wants less sampling error—that is, more precision—or the population size is larger or the population is more heterogeneous.
Table 6.2 Calculating Sample Size Based on Confidence Level, Sampling Error, Population Heterogeneity, and Population Size
|
| Sample Size for 95% Confidence Level | |||||
|
| ± 3% Sampling Error | ± 5% Sampling Error | ± 10% Sampling Error | |||
| Population Size | 50/50 Split | 80/20 Split | 50/50 Split | 80/20 Split | 50/50 Split | 80/20 Split |
| 100 | 92 | 87 | 80 | 71 | 49 | 38 |
| 250 | 203 | 183 | 152 | 124 | 70 | 49 |
| 500 | 341 | 289 | 217 | 165 | 81 | 55 |
| 750 | 441 | 358 | 254 | 185 | 85 | 57 |
| 1,000 | 516 | 406 | 278 | 198 | 88 | 58 |
| 2,500 | 748 | 537 | 333 | 224 | 93 | 60 |
| 5,000 | 880 | 601 | 357 | 234 | 94 | 61 |
| 10,000 | 964 | 638 | 370 | 240 | 95 | 61 |
| 25,000 | 1,023 | 665 | 378 | 243 | 96 | 61 |
| 50,000 | 1,045 | 674 | 381 | 245 | 96 | 61 |
| 100,000 | 1,056 | 678 | 383 | 245 | 96 | 61 |
| 1,000,000 | 1,066 | 682 | 384 | 246 | 96 | 61 |
| 100,000,000 | 1,067 | 683 | 384 | 246 | 96 | 61 |
| How to read this table: For a population with 250 members whom we expect to be about evenly split on the characteristics in which we are interested, we need a sample of 152 to make estimates with a sampling error of no more than ± 5%, at the 95% confidence level. A “50/50 split” means the population is relatively varied. An “80/20 split” means it is less varied; most people have a certain characteristic, a few do not. Unless we know the split ahead of time, it is best to be conservative and use 50/50. | ||||||
| Numbers in the table refer to completed, usable questionnaires needed for various levels of sampling error. Starting sample size should allow for ineligibles and nonrespondents. Note that when the population is small, little is gained by sampling, especially if the need for precision is great. | ||||||
SOURCE: From How to Conduct Your Own Survey by Priscilla Salant and Don A. Dillman, p. 55. Copyright © 1994 by John Wiley & Sons, Inc. Reproduced with permission of John Wiley & Sons, Inc.
In actuality, of course, we draw only one sample; probability theory tells us the chance we run of a single sample’s having a given level of error. There is a chance—5 times out of 100—that the sample will have an error level greater than 3 percent. In fact, there is a chance, albeit a minuscule one, that the sample will have a large error level. This is a part of the nature of sampling: Because we are selecting a segment of a population, there is always a chance that the sample will be unrepresentative of that population. The goal of good sampling techniques is to reduce the likelihood of that error. (Furthermore, one goal of replication in science, as discussed in Chapter 2, is to protect against the possibility that a researcher has unknowingly based the findings of a single study on a sample that contains a large error.)
If the 95 percent confidence level is not satisfactory for our purposes, then we can raise the odds to the 99 percent level by increasing the sample size. (This is not shown in Table 6.2.) In this case, only 1 out of 100 samples is likely to have an error level greater than 3 percent. A sample size large enough for this confidence level, however, might be expensive and time-consuming. For this reason, professional pollsters normally are satisfied with a sample size that enables them to achieve an error level in the range of 2 to 4 percent. Likewise, most scientific researchers are forced to accept higher levels of error—often as much as 5 to 6 percent with a 95 percent confidence level. At the other end of the spectrum, exploratory studies can provide useful data even though they incorporate considerably more imprecision and sampling error. So, the issue of sample size and error is influenced, in part, by the goals of the research project.
Population Homogeneity
The third factor affecting sample size is the variability of the sampled population. As we have noted, a large sample is more essential for a heterogeneous population than for a homogeneous one. Unfortunately, researchers may know little about the homogeneity of their target population and can make accurate estimates of population variability only after they draw the sample, collect the data, and at least partially analyze that data. On the surface, this would appear to preclude estimating sample size in advance. In fact, however, probability theory allows sample size to be estimated by simply assuming maximum variability in the population. In Table 6.2, the assumption of “50/50 split” means that we assume maximum variability. Such estimates are, of course, conservative: This means that the sample size estimates are larger than needed for a given level of precision if the actual variability in the population is less than assumed.
Sampling Fraction
A fourth factor influencing sample size is the sampling fraction, or the number of elements in the sample relative to the number of elements in the population (or n/N, where n is the estimated sample size ignoring sampling fraction and N is the population size). With large populations, we can ignore the sampling fraction, because the sample constitutes only a tiny fraction of the population. In Table 6.2, for example, a population of 10,000 calls for a sample size of only 370 (5 percent sampling error and 50/50 split), which is less than 4 percent of the population. For such samples, the research hypotheses, sampling error, and population homogeneity are sufficient to determine the sample size. With smaller populations, however, a sample that meets these criteria may constitute a relatively large fraction of the whole population and, in fact, may be larger than it needs to be (Moser and Kalton 1972). This is so because a sample that constitutes a large fraction of a population contains less sampling error than if the sample were a small fraction. In such cases, the sample size can be adjusted by the following formula:

Where:
n′ = adjusted sample size,
n = estimated sample size ignoring the sampling fraction
N = population size.
As a rule of thumb, this correction formula should be used if the sampling fraction is more than 5 percent. For example, suppose that a community action agency is conducting a needs assessment survey for a Native-American tribal organization with 3,000 members. On the basis of the research hypothesis, sampling error, and population variance on key variables, it is estimated that a sample size of 600 is needed. The sampling fraction, then, is n/N = 600/3,000 = 0.2, or 20 percent. Because this is well over 5 percent, we apply the correction:
| n′ | = | 600/[1 + (600/3, 000)] |
| n′ | = | 600/1.20 |
| n′ | = | 500 |
Thus, instead of a sample of 600, we need only 500 to achieve the same level of precision. At costs that often exceed $50 per interview, the savings of this adjustment often are significant.
Sampling Technique
The final factor influencing sample size is the sampling technique employed. The estimates discussed thus far are for simple random samples. More complex sampling procedures change the estimates of sample size. Area sampling, for example, tends to increase sampling error in comparison with SRS. We can obtain a rough estimate of sample sizes for area samples by simply increasing the suggested sizes in Table 6.2 by one half (Backstrom and Hursh-Cesar 1981). This estimate is crude and, probably, conservative, but it is simple to obtain. Stratified sampling, on the other hand, tends to reduce sampling error and to decrease the required sample size. Estimating sample sizes for stratified samples is relatively complex (Kish 1965; Scheaffer, Mendenhall, and Ott 2006).
In an assessment of the implications of scientific work for clinical application, the issue of precision in sampling comes to the fore. Practitioners need to exercise judgment regarding how scientifically sound the research is and whether it is sufficiently valid to introduce into practice. As we have emphasized, practitioners should view single studies with caution—irrespective of how low the sampling error is. As numerous studies begin to accumulate, we must then assess them in terms of how much error we can expect, given the sample size and the sampling technique. If the sampling errors appear to be quite low, then a few replications might confirm that the findings from these samples reflect the state of the actual population. With large sampling errors, however, the probability increases that the samples do not represent the population. In such cases, confidence in the outcomes can result only if a number of studies arrive at the same conclusions. More studies mean the drawing of more samples, which in turn reduces the likelihood that all the samples contain large sampling errors.
Nonprobability Samples
Probability samples are not required—or even appropriate—for all studies. Some research situations call for nonprobability samples, in which the investigator does not know the probability of each population element’s inclusion in the sample. Non-probability samples have some important uses (O’Connell 2000). First, they are especially useful when the goal of research is to see whether a relationship exists between independent and dependent variables, with no intent to generalize the results beyond the sample to a larger population. This sometimes is the case, for instance, in experimental research, where future research in other settings will establish generalizability (see Chapter 10).
A second situation where nonprobability samples are useful is in some qualitative research, where the goal is to understand the social process and meaning structure of a particular setting or group (Maxwell 2005). In such qualitative research, the research goal often is only to develop an understanding of one particular setting or group of people; issues of generalizing to other settings are either irrelevant or an issue for future research projects. As we will see in Chapters 9 and 16, some qualitative researchers see probability samples as inappropriate for, or at best irrelevant to, theoretically sound qualitative research.
A third situation in which nonprobability samples are useful is when it is impossible to develop a sampling frame of a population. With no complete list of all elements in a population, researchers cannot ensure that every element has a chance to appear in the sample. These populations sometimes are called “hidden populations,” because at least some of their elements are hidden and either difficult or impossible to locate. In fact, the members of hidden populations sometimes try to hide themselves from detection by researchers and others, because they engage in illegal or stigmatized behavior, such as drug use or criminal activity. Rather than giving up on the study of such populations, however, researchers use nonprobability samples.
Although nonprobability samples can be useful, they do have some important limitations. First, without the use of probability in the selection of elements for the sample, we can make no real claim of representativeness. There is simply no way of knowing precisely what population, if any, a nonprobability sample represents. This question of representativeness greatly limits the ability to generalize findings beyond the level of the sample cases.
A second limitation is that the degree of sampling error remains unknown—and unknowable. With no clear population represented by the sample, we have nothing with which to compare it. The lack of probability in the selection of cases means that the techniques employed for estimating sampling error with probability samples are not appropriate. It also means that the techniques for estimating sample size are not applicable to non-probability samples. Of the five criteria used in considering sample size among probability samples, the only one that comes into play for nonprobability samples is the first—namely, that researchers select sufficient cases to allow the planned types of data analysis. Even population homogeneity and the sampling fraction do not come into play, because the researcher does not know the exact size or composition of the population.
A final limitation of nonprobability samples involves statistical tests of significance. These commonly used statistics, which we will discuss in Chapter 15, indicate to the researcher whether relationships found in sample data are sufficiently strong to generalize to the whole population. Some of these statistical tests, however, are based on various laws of probability and assume a random process for selecting sample elements. Because nonprobability samples violate some basic assumptions of these tests, researchers should use these statistical tests with caution on data derived from such samples.
Availability Sampling
Availability sampling (also called convenience sampling or accidental sampling) involves the researcher’s taking whichever elements are readily available. These samples are especially popular—and appropriate—for research in which it is either difficult or impossible to develop a complete sampling frame. Sometimes it is too costly to do so; in other cases, it is impossible to identify all the elements of a population. Helen Mendes (1976), for example, used an availability sample in her study of single fathers. Because it was practically impossible to develop a sampling frame of all single fathers, she turned to teachers, physicians, social workers, and self-help groups for assistance. She asked these people to refer single fathers to her. The limitation on generalizability, however, seriously reduces the utility of findings based on availability samples. It is impossible for Mendes to argue, for example, that the single fathers she studied were representative of all single fathers. It may well be that only fathers with certain characteristics were likely to become a part of her sample.
Availability samples often are used in experimental or quasi-experimental research. This is because it often is difficult to get a representative sample of people to participate in an experiment—especially one that is lengthy and time-consuming. For example, Ronald Feldman and Timothy Caplinger (1977) were interested in factors that bring about behavior changes in young boys who exhibit highly visible antisocial behavior. Their research design was a field experiment calling for the children participating in the study to meet periodically in groups over an eight-month period. Groups met an average of 22.2 times for two to three hours each time. Most youngsters could be expected to refuse such a commitment of time and energy. Had the investigators attempted to draw a probability sample from the community, they probably would have had such a high refusal rate as to make the representativeness of their sample questionable. They would have expended considerable resources and still had, in effect, a nonprobability sample. So, they resorted to an availability sample. To locate boys who had exhibited antisocial behavior, they sought referrals from numerous sources: mental health centers, juvenile courts, and the like. For a comparison group of boys who were not identified as antisocial, they sought volunteers from a large community center association. Given the purpose of experimentation, representative samples are less important. Experiments serve to determine if we can find cause-and-effect relationships; the issue of how generalizable those relationships are becomes important only after the relationships have been established.
Availability sampling probably is one of the more common forms of sampling used in human service research, both because it is less expensive than many other methods and because it often is impossible to develop an exhaustive sampling frame. For example, in the 20 issues of the journal Social Work Research published from 1994 through 1999, at least 52 of the 88 research articles could be classified as reporting some form of availability sample. You can readily grasp the problems of trying to develop a sampling frame in the following studies:
Turning points in the lives of young inner-city men previously involved in violence, illegal drug marketing, and other crimes and now contributing to their community’s well-being: The sample consisted of 20 young men, most of whom were referred by intervention programs, pastors, and community leaders.
A study on methods for preventing HIV/AIDS transmission in drug-abusing, incarcerated women: The sample consisted of inmates at Rikers Island who were recruited with posted notices and staff referrals.
A study on effectiveness of a program to reduce stress, perceived stigma, anxiety, and depression for family members of people with AIDS: Participants were recruited from an AIDS service program.
Depression and resilience in elderly people with hip fractures: The sample consisted of 272 patients over age 65 who were hospitalized following hip fractures.
An exhaustive sampling frame that would make possible the selection of a probability sample in each of these studies might be, respectively, as follows:
All reformed/rehabilitated young adult offenders.
All drug-abusing, incarcerated women.
All family members of people infected with AIDS.
All elderly people with hip fractures.
Clearly, such probability sampling is beyond the realm of most investigators. Availability samples, though less desirable, make it possible for scientific investigation to move forward in those cases when probability sampling is impossible or prohibitively expensive.
Snowball Sampling
When a snowball is rolled along in wet, sticky snow, it picks up more snow and gets larger. This is analogous to what happens with snowball sampling: We start with a few cases of the type we want to study, and we let them lead us to more cases, which in turn lead us to still more cases, and so on. Like the rolling snowball, the snowball sample builds up as we continue to add cases. Because snowball sampling depends on the sampled cases being knowledgeable of other relevant cases, the technique is especially useful for sampling subcultures where the members routinely interact with one another. Snowball sampling also is useful in the investigation of sensitive topics, such as child abuse or drug use, where the perpetrators or the victims might hesitate to identify themselves if approached by a stranger, such as a researcher, but might be open to an approach by someone who they know shares their experience or deviant status (Gelles 1978).
Snowball sampling allows researchers to accomplish what Norman Denzin (1989) calls interactive sampling—that is, sampling people who interact with one another. Probability samples are all non-interactive samples, because knowing someone who is selected for the sample does not change the probability of selection. Interactive sampling often is theoretically relevant, because many social science theories stress the impact of associates on behavior. To study these associational influences, researchers often combine snowball sampling with a probability sample. For example, Albert Reiss and Lewis Rhodes (1967), in a study of associational influences on delinquency, drew a probability sample of 378 boys between the ages of 12 and 16. They then asked each member of this sample to indicate his two best friends. By correlating various characteristics of the juveniles and their friends, the researchers were able to study how friendship patterns affect delinquency.
This interactive element, however, also points to one of the drawbacks of snowball sampling: Although it taps people who are involved in social networks, it misses people who are isolated from such networks. Thus, a snowball sample of drug users is limited to those users who are part of some social network and ignores those who use drugs in an individual and isolated fashion. It is possible that drug users who are involved in a social network differ from isolated users in significant ways. Care must be taken in making generalizations from snowball samples to ensure that we generalize only to those people who are like those in our sample.
Quota Sampling
Quota sampling involves dividing a population into various categories and then setting quotas on the number of elements to select from each category. Once we reach the quota for each category, we put no more elements from that category into the sample. Quota sampling is like stratified sampling in that both divide a population into categories and then take samples from the categories, but quota sampling is a nonprobability technique that often depends on availability to determine precisely which elements will be in the sample. At one time, quota sampling was the method of choice among many professional pollsters. Problems deriving from efforts to predict the very close 1948 presidential election between Harry S. Truman and Thomas E. Dewey, however, caused pollsters to turn away from quota sampling and to embrace the newly developed probability sampling techniques. With its fall from grace among pollsters, quota sampling also declined in popularity among researchers. Presently, use of quota sampling is best restricted to those situations where its advantages clearly outweigh its considerable disadvantages. For example, researchers might use quota sampling to study crowd behavior, for which they cannot establish a sampling frame given the unstable nature of the phenomenon. A researcher who is studying reaction to disasters, such as a flood or a tornado, might use quota sampling where the need for immediate reaction is critical and takes precedence over sample representativeness.
Researchers normally establish quotas for several variables, including such common demographic characteristics as age, sex, race, socioeconomic status, and education. In addition, they commonly include one or more quotas directly related to the research topic. For example, a study of political behavior would probably include a quota on political party affiliation to ensure that the sample mirrored the population on the central variable in the study.
In quota sampling, interviewers do the actual selection of respondents. Armed with the preestablished quotas, interviewers begin interviewing people until they have their quotas on each variable filled. The fact that quota sampling uses interviewers to do the actual selection of cases is one of its major shortcomings. Despite the quotas, considerable bias can enter quota sampling because of interviewer behavior. Some people simply look more approachable than others, and interviewers naturally gravitate toward them. Interviewers also are not stupid. They realize that certain areas of major cities are less-than-safe places to go around asking questions of strangers, and protecting their personal safety by avoiding these areas can introduce obvious bias into the resulting sample.
While there is a risk of bias with quota samples, the technique does have some major positive attributes—namely, it is cheaper and faster than probability sampling. At times, these advantages can be sufficient to make quota sampling a logical choice. For example, if we wanted a rapid assessment of people’s reactions to some event that had just occurred, quota sampling would probably be the best approach.
Purposive Sampling
In the sampling procedures discussed thus far, one major concern has been to select a sample that is representative of—and will enable generalizations to—a larger population. Generalizability, however, is only one goal, albeit an important one, of scientific research. In some studies, the issue of control may take on considerable importance and dictate a slightly different sampling procedure. In some investigations, control takes the form of choosing a sample that specifically excludes certain types of people, because their presence might confuse the research findings. For example, if a researcher were conducting an exploratory study of a psychotherapeutic model of treatment, he or she might wish to choose people for the sample from among “ideal candidates” for psychotherapy. Because psychotherapy is based on talking about oneself and gaining insight into feelings, ideal candidates for psychotherapy are people with good verbal skills and the ability to explore and express their inner feelings. Because well-educated, middle-class people are more likely to have these characteristics, a researcher might choose them for the sample.
This is called purposive sampling, or judgmental sampling: The investigators use their judgment and prior knowledge to choose for the sample people who best serve the purposes of the study. This is not “stacking the deck” in the researcher’s favor, however. Consider the illustration given earlier: The basic research question is whether this type of psychotherapy can work at all. If we select a random sample, we get a variation based on age, sex, education, socioeconomic status, and a host of other variables that are not of direct interest in this study but that might influence receptive-ness to psychotherapy. Certainly, in a truly random sample, the effects of this variation would wash out. The sample, however, would have to be so large that we could not do psychotherapy on that many people. So, rather than use some other sampling technique, we choose a group that is homogeneous in terms of the factors that are likely to influence receptiveness to psychotherapy. This enables us to see whether psychotherapy works better than some other form of therapy. If it does not work with this ideal group, then we can probably forget the idea. If it does work, then we can generalize only to this group, with further research among other groups still required to see how extensively we can generalize the results.
Research in Practice 6.2 illustrates some of the kinds of research problems we can approach with nonprobability samples and how a sampling strategy might actually involve a creative combination of some of the sampling types discussed here.
Dimensional Sampling
It often is expeditious—if not essential—to use small samples. Small samples can be very useful, but we must exercise considerable care in drawing the sample. (The smallest sample size, of course, is the single case, which we will discuss in Chapter 11.) Dimensional sampling is a sampling technique for selecting small samples in a way that enhances their representativeness (Arnold 1970). The two basic steps to dimensional sampling are these: First, specify all the important dimensions or variables. Second, choose a sample that includes at least one case that represents each possible combination of dimensions.
We can illustrate this with a study of the effectiveness of various institutional approaches in the control of juvenile delinquency (Street, Vinter, and Perrow 1966). The population consisted of all institutions for delinquents. To draw a random sample of all those institutions, however, would have made a sample size that would tax the resources of most investigators. As an alternative, the researchers used a dimensional sample. The first step was to spell out the important conceptual dimensions. In terms of juvenile institutions, this investigation considered three dimensions, each containing two values, as illustrated in Table 6.3: organizational goals (custodial or rehabilitative), organizational control (public or private), and organizational size (large or small). In the second step, the researchers selected at least one case to represent each of the eight possibilities that resulted.
Table 6.3 An Illustration of Institutional Dimensions for a Dimensional Sample
|
| Custodial Goals | Rehabilitative Goals | ||
|
| Public | Private | Public | Private |
| Large Size |
|
|
|
|
| Small Size |
|
|
|
|
Dimensional sampling has a number of advantages that make it an attractive alternative in some situations. First, it is faster and less expensive than studying large samples. Second, it is valuable in exploratory studies with little theoretical development to support a large-scale study. Third, dimensional sampling provides more detailed knowledge of each case than we would likely gain from a large sample. With a large sample, data collection necessarily is more cursory and focused (which is justified if previous research has narrowed the focus of what variables are important).
Research in Practice 6.2: Behavior and Social Environments: Using Nonprobability Samples to Study Hidden Populations
One of the major advantages of nonprobability samples is that they enable us to gain access to “hidden populations”—that is, people who are difficult to locate or who, for one reason or another, prefer to hide their identity or behavior from the prying eyes of authorities, social science researchers, and others (O’Connell 2000). Typically, we cannot construct sampling frames for such groups. Area or cluster sampling is not feasible either, so probability samples are out of the question. Thus, studies of illicit drug users typically use nonprobability samples, with sampling strategies involving variants on or combinations of such strategies as snowball, quota, and purposive sampling. Douglas Heckathorn (1997), for example, used a variant of snowball sampling, which he called respondent-driven sampling, in a study of intravenous drug users and AIDS. He began with a small group of drug users, called “seeds,” who were known to the researchers; each seed was asked to contact three other drug users he or she knew. The seeds received a payment for their interviews and an additional payment when each of the people they contacted came in for an interview. Each recruit interviewed then became a seed and was sent out to contact others. The procedure, especially the incentives, proved to be successful in recruiting other drug users and protected the privacy of the users, because the researchers didn’t learn anyone’s name until he or she voluntarily came in for the interview.
One drawback of snowball samples is that they can produce “masking”—that is, when a respondent protects the privacy of others by not referring them to the researchers. Researchers must take care in making generalizations from snowball samples to ensure that we generalize only to those people who are like those in our sample. Actually, Heckathorn presents evidence to show that his respondent-driven sampling procedure substantially reduces the masking bias.
With all the incentives available in Heckathorn’s study, consider that a subject might try to take advantage of the situation. Given the overlapping networks among drug users, it is highly likely that more than one recruiter might contact a single user, creating the possibility that one user could get interviewed twice by assuming a false identity at the second interview (and, thus, get two rewards). Heckathorn reduced the likelihood of this happening by recording visible identifying characteristics of each person interviewed: gender, age, height, ethnicity, scars, tattoos, and other characteristics that, in combination, identify a particular person. The concern here is less about money than about validity: If one person contributes multiple interviews, then the overall results become biased in the direction of that person.
Targeted sampling is a sampling strategy with similarities to both quota and purposive sampling; it involves strategies to ensure that people or groups with specified characteristics have an enhanced chance of appearing in the sample. In other words, researchers target specified groups for special efforts to bring them into the sample. We might identify the targeted groups for theoretical reasons, because they would be especially useful for gathering certain kinds of information. Or, we might identify them during the data-collection process if we find that some groups are not showing up in the sample. So, targeted sampling is interactive, with the results of data collection possibly changing the method of sampling.
An example of targeted sampling is a study of injecting drug users conducted by John Watters and Patrick Biernacki (1989). They began by constructing an “ethnographic map” of the city in which they were conducting their research. This told them where drug users and drug activity tended to occur, in what amounts, and what the characteristics of the users in different locations were. This information provided the basis for deciding where to start recruiting people for participation in their study. This ethnographic map also told them that snowball sampling alone probably wouldn’t work, because the drug scene they found consisted of many nonoverlapping social networks. This meant that any network in which they could not find an initial informant probably would not show up in their sample.
Watters and Biernacki targeted neighborhoods in the city for sampling based partly on racial composition. They wanted to ensure adequate numbers of black and Latino drug users in their sample. To enhance Latino participation, for example, they sent two Latino males who were familiar with the drug scene into the community to inform people of the research, to encourage their participation, and eventually, to drive people to the center where the data were collected. As data collection proceeded, Watters and Biernacki recognized that an insufficient number of female injecting drug users were showing up in the sample, so they revised the sampling techniques to enhance participation by women. One reason for the low participation by women, they learned, was that some of the female users were prostitutes, and going to the center to participate in the research meant that they lost time working the streets to earn money. To help alleviate this, the researchers established a “ladies first” policy at the data-collection sites: If there was a wait, women received precedence over men. This and other strategies were an effort to target women and get adequate numbers in the sample.
Heckathorn (1997), in his respondent-driven sampling, also used a form of targeted sampling to reduce bias problems that might arise because some groups of drug abusers are isolated from contact with others. He used “steering incentives” in the form of bonus payments for contacting drug users with special characteristics. For example, female users also were somewhat rare in his sample, so anyone contacting a female injector who then showed up for an interview received an extra $5.
So, even though nonprobability sampling techniques such as those presented here are not suitable for population studies in which the goal is to obtain precise estimates of population parameters, nonprobability approaches are extremely valuable for accessing hidden populations and increasing our understanding of these groups. With these techniques, researchers may not be able to compute sampling error as we could with random sampling, but we still can improve the representative quality of the sample with such techniques as targeted sampling and, thus, enhance the value of the study results. Given the goals of the study and the reality of accessing the population, a researcher’s best option often is a nonprobability sampling strategy. The Eye on Ethics section points to some ethical issues that can arise with these sampling procedures.
Despite their limitations, nonprobability samples can be valuable tools in the conduct of human service research; however, we want to reiterate two points. First, some research uses both probability and nonprobability samples in a single research project, and we have given some illustrations of this. The point is that the two types of samples should not be considered as competitors for attention. Second, we should view findings based on nonprobability samples as being suggestive rather than conclusive, and we should seek opportunities to retest their hypotheses using probability samples.
Sampling with Minority Populations
The key to selecting scientifically valid samples is to ensure their representativeness so that we can make valid generalizations. Accomplishing this is an especially difficult challenge when we are conducting research on racial or ethnic minorities. One problem is that some minorities have “rare event” status—that is, they constitute a relatively small percentage of some populations. African Americans and Hispanic Americans, for example, each constitute approximately 12 percent of the U.S. population, while Native Americans are about 3 percent (U.S. Census Bureau 2008). This means that a representative sample of 1,500 Americans would, if it included the proper proportions of minorities, contain 180 African Americans, 180 Hispanics, and 45 Native Americans. These numbers are too small for many data analysis purposes. The Native Americans especially are so few that any analysis that breaks the sample down into subgroups would result in meaninglessly small numbers in each subgroup. Furthermore, these small numbers mean that the error rate becomes much higher for minority groups than for nonminority groups, because small samples are less reliable and have more error (A.W. Smith 1987). These small sample sizes also make it difficult to assess differences of opinion or behavior within a minority group; thus, it is easy to conclude—falsely—that the group is homogeneous. As a consequence, we know little about gender, social class, regional, or religious differences among members of particular minorities. The outcome, according to Smith (1987, p. 445), is “little more than a form of stereotyping, an underestimation of the variability of opinions among blacks. This leads to an overestimation of the contribution of race, per se, to black-white differences” in attitude and behavior. The Committee on the Status of Women in Sociology (1986) makes the same recommendations regarding gender: “Research should include sufficiently large subsamples of male and female subjects to allow meaningful analysis of subgroups.”
Eye on Ethics: Ethical Issues with Respondent-Driven Sampling
It’s like a pyramid scheme, man. Somebody turns me onto the gig, and they make money off me doin’ it. Then I get money for doin’ it, for givin’ up an hour or two of my time. Then I turn some buddies or some blood kin or maybe even some complete fuckin’ strangers onto this here shit, and I get paid for each of them that do it.... It’s a survival thing, and most of us is gonna jump this pyramid and dig it down as far and deep as we can. And it ain’t ‘cause we bad people or liars or thieves or nothin’ like that. But the fact is, we got habits to support, and we got families to feed.
Intravenous drug user on respondent-driven sampling as income source. Scott (2008, p. 45)
Research in Practice 6.2 describes the use of respondent-driven sampling (RDS) to study hidden populations, such as intravenous drug users (IDUs). Despite the advantages of RDS, researchers have identified significant ethical challenges that must be addressed when using RDS. One concern is the double-payment strategy used in RDS. First, volunteers for a study are paid a modest amount, about $20, to participate. Second, they receive three coupons, worth $10 dollars each. They receive a $10 payment for each participant whom they recruit who actually participates in the study. Because payment depends on successful recruitment, the participant has a high incentive to get others to actually participate.
One researcher, who has actually conducted research on how drug users respond to this payment system, has been particularly critical (Scott 2008). Among his concerns about such payments are:
IDUs are generally poor, so might even a small payment jeopardize voluntary consent?
Might not payment simply facilitate more drug use?
Might participants lie about or distort the description of the program in order to entice potential recruits?
Might recruiters resort to strong-arm tactics and threaten others into participating, just to get their money?
Experts in RDS acknowledge these problems, but argue that safeguards can alleviate them. They emphasize that, because recruiters are limited to three coupons, it prevents them from becoming “professional” recruiters. Researchers require informed consent from each individual recruited by participants, and this can protect against coercion or misrepresentation. Another strategy for addressing the concerns is to expect researchers to include documentation of procedures that they use in their research projects to reduce the risk. For example, just as study reports document statistical analysis, they should also include RDS details such as motivation for recruitment, motivation for study participation, assessment of coercion or undue influence, amount of payment for each recruit, and amount of payment for study participation (Semaan et al. 2009).
Some minorities have rare event status in another way that can cause problems in sampling. Because of substantial residential segregation of minorities in the United States, minorities who live in largely white areas are relatively small in number, and researchers can easily miss them by chance even in a well-chosen, representative sample. The result is a biased sample that includes minorities living in largely minority communities but not minorities living elsewhere. Because minorities living in nonminority communities probably vary in terms of attitudes and behavior, such a biased sample gives a deceptively homogeneous picture of the minority.
So, efforts must be made in sampling to ensure that those rare events have a chance at selection for the sample. In some cases, we can employ disproportionate sampling, in which some individuals or households have a greater probability of appearing in the sample than other individuals or households do. Another way to avoid some of these problems is to use both probability and nonprobability sampling techniques when studying minorities (Becerra and Zambrana 1985). A dimensional sample of Hispanics, for example, might specify an entire series of dimensions to cover in the sample. Thus, a researcher might specify certain age cohorts of Hispanic women (20–30, 31–40, and 41 and older) to include in the sample or some minimum number of single-parent and two-parent Hispanic families. This would ensure that sufficient people with certain characteristics are in the sample for valid data analysis. A study of mental health among Asian immigrants in the Seattle area used the snowball technique to ensure a complete sampling frame (Kuo and Tsai 1986). Those researchers used local telephone directories and gathered names from ethnic and community organizations to develop part of the sampling frame. Then, given the dispersion of Asian Americans in the area, researchers added the snowball technique.
A Note on Sampling in Practice
Human service practitioners do not routinely engage in sampling procedures like those used for research purposes, yet parallels exist between what occurs in practice and in research. We can apply some of the sampling principles in this chapter to providing client services. The needs and characteristics of a particular client typically guide the assessments and actions of practitioners, but to what extent are judgments about one client based on experiences with other clients? The issue here, of course, is that of generalizability. As human beings, we constantly dip into our own funds of experience to help us cope with situations that we confront. Practitioners use their past experience with clients—sometimes very effectively—to grapple with the problems of subsequent clients. The critical judgment to make in this regard is whether it is legitimate to generalize past outcomes to current situations.
Practice settings rarely involve dealing with probability samples. Irrespective of whether the clients are welfare recipients, elderly people receiving nursing home care, child abusers, or individuals with problem pregnancies, practitioners have no way of knowing whether all people with such characteristics had a chance to be in the “sample”—that is, to be one of their clients—or how great that chance was. For all practical purposes, then, practitioners deal with non-probability samples and all the limitations that they entail. In most cases, practitioners have an availability sample of people who happen to come to their attention because they are clients. This means that practitioners need to show caution in making generalizations from their observations, but this is no reason for despair. Remember that many scientific investigations are based on availability samples. We simply need to recognize their limitations and use care in generalizing.
If the main concern is to generalize to other clients with similar problems, then a reasonable assumption is that the clients are representative of others with similar problems who seek the aid of a practitioner. Whatever propels people to see a particular practitioner is probably operative for many—if not all of-—that practitioner’s other clients. If the practitioner’s research interest concerns all people experiencing a certain type of problem, then agency clients are not an appropriate sample. Agencies both intentionally and unintentionally screen their prospective clients; thus, many people who could use services are not included in a sample of agency clients. The well-known study by Robert Scott (1975) on agencies that serve the blind is a classic example. Scott found that these agencies concentrate their efforts on young, trainable clientele, even though most blind people are elderly or have multiple handicaps. If workers in such an agency assumed that the agency clientele represented all blind people, then they would have a distorted perspective on the actual blind population.
Information Technology in Research: Sampling in a Cell Phone World
The spread of cell phones has been dramatic. One estimate is that, by the time you read these words, 40 percent or more of young adults will have a cell phone only and no landline (Ehlen and Ehlen, 2007). In fact, one can imagine a future where landlines become rare, and all or most voice communication is wireless. These technological changes produce challenging problems for sampling in social research when contacting respondents is done through a telephone link.
The nature of cell phone technology has implications for the unit of analysis in research. Traditionally, telephones (now called “landlines”) were linked to a particular geographic location, such as a house or office. This was a physical link in that the phone line went to that location and the appliance could be used only at that place. Since most homes had only one telephone line, this made telephone listings a very useful sampling frame when the household was the unit of analysis.
Cell phone technology is different in that a cell phone is free-ranging; it isn’t inherently connected to a particular location or individual (an individual may have the contract for cell phone service, but the phone itself can be carried and used by others in any location). So, cell phone numbers are not a very good sampling frame for households since they are not linked in any meaningful or complete way to a household. In addition, a single household may have numerous phones, such as a landline and one or more cell phones. This has an impact on the probability of being selected for a sample. If telephone listings are used as sampling frames, then each phone represents one chance for being selected into a sample. A household with one landline only has one chance of being selected. A household with one landline and two cell phones has three times as many chances to be selected for the sample. Recall from this chapter that some probability samples are based on the idea that each element in a sampling frame should have an equal chance of appearing in the sample. Cellphone technology has dramatically changed that because of the many households with multiple phones. It also forces researchers to think more clearly about the unit of analysis because cell phones are less clearly linked to households or individuals. Some households are cell phone-only, where all adults share one cell phone—more like a traditional landline. In other cases, each adult in the household has his or her own cell phone, which means that a telephone number is linked to an individual, not a household.
One way to address some of these problems is to do what are called “dual-frame surveys” in which samples are taken from both landline and cell phone numbers. Since people who have both types of phones will have a greater probability of appearing in the sample, people contacted by cell phone can be asked if they also have a landline; if they do, then the interview on the cell phone is terminated and they will be interviewed only if contacted on their landline.
These sampling issues can be of critical importance in both practice and policy research because of the possibility that poor sampling will produce unrepresentative samples and thus misleading or inaccurate results. Studies report, for example, that surveys using only landline samples will contain significantly fewer young and lower income people in the sample and more married and better educated people (Blumberg and Luke 2007; Tucker, Brick, and Meekins 2007). This will produce substantial underestimations of the prevalence of binge drinking, smoking, and HIV testing. Clearly, policies related to these problems could be more poorly designed if based on such distorted samples.
Ways of checking on such distortions exist, of course. For example, practitioners can compare notes with each other. Do they find the same kinds of problems among their clients? If so, that is support for an assumption that one set of clients is representative of all people with similar problems. Practitioners also might consider using (at least informally) other sampling techniques, such as adopting a snowball technique by asking clients to recommend someone they know who has a similar problem but is not receiving any services. Especially with people whose problems may be of a sensitive nature, this snowball approach is a mode of entry with a considerable likelihood of success. Another possibly effective sampling technique is purposive sampling. For example, in an agency dealing with unplanned pregnancies among teenagers, suppose that all clients are members of ethnic minorities. It might appear that the clients’ behavior, such as hostility toward practitioners, is caused either by the crisis of the pregnancy or by the animosity of a minority member toward the welfare bureaucracy. The problem is a sample that is homogeneous with respect to two variables that may be important: The clients all have problem pregnancies, and the clients are all members of an ethnic minority. To get around this problem, the researcher might begin to choose a purposive sample in which the problem pregnancies occur among nonminority teenagers and, thus, be in a better position to determine the source of the hostility.
In some ways, dimensional sampling is the most feasible form for practitioners. In our previous illustration, for example, there are two variables—namely, race and pregnancy status—with two values each—namely, white versus nonwhite and pregnant versus not pregnant. Thus, the analysis contains four possible cells. If for some reason, such as past experience, the researcher believes that these two variables interrelate in important ways in determining such factors as client hostility or adjustment, then he or she could make sure that at least one client was in each of those four cells to make some preliminary judgments regarding the importance of these two factors.
Review and Critical Thinking
Main Points
A population consists of all possible cases of whatever a researcher is interested in studying.
A sample is composed of one or more elements selected from a population.
A sampling frame is a list of the population elements that are used to draw some types of probability samples.
The representativeness of a sample is its most important characteristic and refers to the degree to which the sample reflects the population from which it was drawn.
Sampling error is the difference between sample values and true population values.
Probability sampling techniques are the best for obtaining representative samples.
The key characteristic of probability sampling is that every element in the population has a known chance of selection into the sample.
Simple random, systematic, stratified, and area samples are all types of probability samples.
Nonprobability samples do not assure each population element a known chance of selection into the sample and, therefore, lack the degree of representativeness of probability samples.
Availability, snowball, quota, purposive, and dimensional samples are all types of nonprobability samples.
Data based on properly drawn probability samples are reliable and generalizable within known limits of error to the sampled populations.
In studies of racial and other minorities, researchers must take care to ensure that sampling procedures do not result in unrepresentative samples, especially given the “rare event” status of many minorities.
Cell phones have created sampling challenges for researchers because it is now more difficult to use telephone numbers as a sampling frame.
Important Terms for Review
accidental sampling
area sampling
availability sampling
cluster sampling
convenience sampling
dimensional sampling
judgmental sampling
multistage sampling
nonprobability samples
population
probability samples
purposive sampling
quota sampling
representative sample
respondent-driven sampling
sample
sampling error
sampling frame
simple random sampling
snowball sampling
stratified sampling
systematic sampling
targeted sampling
Critical Thinking
Human service practitioners and policy makers, of course, draw conclusions from observations they have made. The critical thinking question is whether those observations provide an adequate basis from which to deduce something. The observations made in scientific research differ from everyday observations because they are much more systematic in nature, and being systematic has to do, in part, with sampling, or how you select which people or elements are to be observed. With what you have learned about sampling in this chapter, you have some tools with which to assess whether observations made in practice settings or everyday life provide a sound basis for drawing conclusions:
What is the whole group (or population) about which you want to draw conclusions?
What groups or people serve as the source of information? How were they selected? Are there people or groups who had no chance to show up in this sample? Could this lead to misunderstanding or inaccuracy?
Could the people observed be considered a probability sample? A nonprobability sample? What problems does this create as far as drawing conclusions to the whole group or population?
Are there other ways the sample could have been selected that could have produced a more accurate, or at least a different, conclusion or understanding?
Exploring the Internet
To expand your knowledge about sampling and how researchers use sampling in research, we recommend that you explore Internet sites affiliated with some of the major survey research endeavors that produce social science research data. Following are several sites that include information about the sampling processes in their surveys. Once you have accessed the main site, look for highlighted text about sampling procedures.
The General Social Survey (GSS) site (www.norc.org/GSS+Website/) has its own search capacity, which makes locating material of interest fairly easy. Entering the term “sampling” in the search engine will lead to a variety of pages dealing with sampling. From this Web site, you can learn how the GSS sample actually is selected, how the procedure has changed over time, and what controversies have arisen concerning the sampling system modifications. Also, search for the term “primary sampling unit, “and describe what it is and what role it plays in sampling procedures (see Research in Practice 6.1).
The Crime Victimization Survey is a major survey conducted by the Bureau of Justice Statistics (www.ojp.usdoj.gov/bjs/welcome.html). Explore this site to find the actual results of the most recent crime victimization survey and to learn about the sampling procedures used in the study.
The U.S. Bureau of Labor Statistics and the U.S. Census Bureau cooperate in providing the Current Population Survey (CPS). To learn more about how sampling is done for this key survey, visit the CPS Web site (www.bls.census.gov/cps/cpsmain.htm).
For Further Reading
Henry, Gary T. Practical Sampling. Newbury Park, Calif.: Sage, 1990. This concise book is a handy guide to basic issues related to sampling. It also includes some interesting examples of research projects and the sampling procedures they used.
Hess, Irene. Sampling for Social Research Surveys, 1947–1980. Ann Arbor: University of Michigan Institute for Social Research, 1985. Sometimes, a good example can enhance the understanding of complex subjects, and that is what Hess provides in her historical review of survey sampling. In addition, she provides further discussion of many sampling issues.
Kish, Leslie. Survey Sampling. New York: Wiley—Interscience, 1995. Considered to be the mainstay regarding sampling issues in social research, this book assumes that the reader has an elementary understanding of statistics.
Maisel, Richard, and Caroline Hodges Persell. How Sampling Works. Thousand Oaks, Calif.: Pine Forge Press, 1996. This book provides an excellent and detailed overview of scientific sampling as well as software to assist students in learning through working problems.
Scheaffer, Richard L., William Mendenhall, and R. L. Ott. Elementary Survey Sampling, 6th ed. Belmont, Calif.: Thomson, Brooks/Cole, 2006. As the name implies, this book is meant as an introductory text on the design and analysis of sample surveys. Limited to coverage of probability sampling techniques, it provides the information necessary to successfully complete a sample survey.
Stuart, Alan. The Ideas of Sampling, 3rd ed. New York: Oxford University Press, 1987. This book is another good review of sampling strategies that can be used in many human service settings.
Sudman, Seymour. Applied Sampling. New York: Academic Press, 1976. This book, along with the Kish work, will tell you almost all you need to know about sampling.
Wainer, Howard. Drawing Inferences from Self-Selected Surveys. New York: Springer—Verlag, 1986. This book focuses on the issue of self-selection into samples and the problems this can create in terms of making inferences from samples to populations.
Exercises for Class Discussion
A student is doing an internship with the Metropolis Senior Citizens Service Center (MSCSC), where she has been asked to help conduct a needs assessment. The MSCSC is a publicly funded agency that is supposed to serve all residents of Metropolis who are 60 years of age or older. Spouses of such individuals also are eligible to receive services if they are at least 50 years old. As a part of the internship, the director wants the student to conduct interviews with all senior citizens in this city of 25,000 inhabitants. The student, having taken a research methods course, knows that this would be time-consuming and inefficient—as well as unnecessary. She suggests that selecting a probability sample and conducting careful interviews with those selected will yield better information with less interviewing time. The director tells her to develop a plan to convince the agency board how she might accomplish this.
| 6.1. | What is the population for this project? Define the population as specifically as possible. |
| 6.2. | Three sampling frames the intern might use are (a) the city directory, (b) the local telephone book, and (c) a Social Security Administration listing of recipients of benefits for the county. What might be the advantages and disadvantages of each? Can you think of any other sampling frames that could be useful for this project? |
| 6.3. | Could you use a random-digit dialing method to sample this population? Indicate reasons for and against using such a technique. |
| 6.4. | A staff member at the agency suggests dispensing with the sampling and just running a series of public service announcements on the local radio station and in the newspaper that ask senior citizens to call the agency to express their concerns. The researcher could interview those people who call in, and those interviews would constitute the needs assessment. What kind of sampling process is being suggested? What are its advantages and disadvantages? |
| 6.5. | The elderly who reside in nursing homes make up a group of special interest to the center, although they represent only 1.5 percent of the eligible residents. Describe how sampling procedures could address the problem of including a representative group of nursing home elderly in the sample. |
| 6.6. | Use your local city directory to compile a simple random sample of 25 households using the street address portion of the directory. |
| 6.7. | In the previous exercises, options included random-digit dialing, the city directory, the telephone book, Social Security recipients, and respondents to radio announcements. Evaluate each of these options in terms of its potential for underrepresenting minorities in the sample. Which method would be best? |
Designing Questions
Closed-Ended versus Open-Ended Questions
Wording of Questions
Questionnaires
Structure and Design
Response Rate
Checking for Bias Due to Nonresponse
An Assessment of Questionnaires
Interviews
The Structure of Interviews
Contacting Respondents
Conducting an Interview
Minorities and the Interview Relationship
An Assessment of Interviews
Telephone Surveys
Online Surveys
Focus Groups
Practice and Research Interviews Compared
Review and Critical Thinking
Main Points
Important Terms for Review
Critical Thinking
Exploring the Internet
For Further Reading
Exercises for Class Discussion
The term survey both designates a specific way of collecting data and identifies a broad research strategy. Survey data collection involves gathering information from individuals, called respondents, by having them respond to questions. We use surveys to gather data as a part of many of the research methods discussed in other chapters, such as qualitative studies, quantitative studies, experiments, field research, and program evaluations. In fact, the survey probably is the most widely used means of gathering data in social science research. A literature search in the online database Sociological Abstracts (SocAbs) for the five-year period from 1998 to 2002 using the key-word search terms “social work” and “survey” identified more than 600 English-language journal articles. Surveys have been used to study all five of the human service focal areas discussed in Chapter 1. This illustrates a major attraction of surveys—namely, flexibility.
As a broad research strategy, survey research involves asking questions of a sample of people, in a fairly short period of time, and then testing hypotheses or describing a situation based on their answers. As a general approach to knowledge building, the strength of surveys is their potential for generalizability. Surveys typically involve collecting data from large samples of people; therefore, they are ideal for obtaining data that are representative of populations too large to deal with by other methods. Consequently, many of the issues addressed in this chapter center around how researchers obtain quality data that are, in fact, representative.
All surveys involve presenting respondents with a series of questions to answer. These questions may tap matters of fact, attitudes, opinions, or future expectations. The questions may be simple, single-item measures or complex, multiple-item scales. Whatever the form, however, survey data basically are what people say to the investigator in response to a question. We collect data in survey research in two basic ways: with questionnaires, or with interviews. A questionnaire contains recorded questions that people respond to directly on the questionnaire form itself, without the aid of an interviewer. A questionnaire can be handed directly to a respondent; can be mailed or sent online to the members of a sample, who then fill it out on their own and send it back to the researcher; or can be presented via a computer, with the respondent recording answers with the mouse and keypad. An interview involves an interviewer reading questions to a respondent and then recording his or her answers. Researchers can conduct interviews either in person or over the telephone.
Some survey research uses both questionnaire and interview techniques, with respondents filling in some answers themselves and being asked other questions by interviewers. Because both questionnaires and interviews involve asking people to respond to questions, a problem central to both is what type of question we should use. In this chapter, we discuss this issue first, and then we analyze the elements of questionnaires and interviews separately. An important point to emphasize about surveys is that they only measure what people say about their thoughts, feelings, and behaviors. Surveys do not directly measure those thoughts, feelings, and behaviors. For example, if people tell us in a survey that they do not take drugs, we have not measured actual drug-taking behavior, only people’s reports about that behavior. This is very important in terms of the conclusions that can be drawn: We can conclude that people report not taking drugs, but we cannot conclude that people do not take drugs. This latter is an inference we might draw from what people say. So, surveys always involve data on what people say about what they do, not what they actually do.
Designing Questions
Closed-Ended versus Open-Ended Questions
Two basic types of questions are used in questionnaires and interviews: closed-ended, or open-ended (Sudman and Bradburn 1982). Closed-ended questions provide respondents with a fixed set of alternatives from which to choose. The response formats of multiple-item scales, for example, are all closed-ended, as are multiple-choice test questions. Open-ended questions require that the respondents write their own responses, much as for an essay-type examination question.
The proper use of open- and closed-ended questions is important for the quality of data generated as well as for the ease of handling that data. Theoretical considerations play an important part in the decision about which type of question to use. In general, we use closed-ended questions when we can determine all the possible, theoretically relevant responses to a question in advance and the number of possible responses is limited. For example, The General Social Survey question for marital status reads, “Are you currently—married, widowed, divorced, separated, or have you never been married?” A known and limited number of answers is possible. (Today, researchers commonly offer people an alternative answer to this question—namely, “living together” or cohabitating. Although cohabitation is not legally a marital status, it helps to accurately reflect the living arrangements currently in use.) Another obvious closed-ended question is about gender. To leave such questions open-ended runs the risk that some respondent will either purposefully or inadvertently answer in a way that provides meaningless data. (Putting “sex” with a blank after it, for example, is an open invitation for some character to write “yes” rather than the information wanted.)
Open-ended questions, on the other hand, are appropriate for an exploratory study in which the lack of theoretical development suggests that we should place few restrictions on people’s answers. In addition, when researchers cannot predict all the possible answers to a question in advance, or when too many possible answers exist to list them all, then closed-ended questions are not appropriate. Suppose we wanted to know the reasons why people moved to their current residence. So many possible reasons exist that such a question has to be open-ended. If we are interested in the county and state in which our respondents reside, then we can generate a complete list of all the possibilities and, thus, create a closed-ended question. This list would consume so much space on the questionnaire, however, that it would be excessively cumbersome, especially considering that respondents should be able to answer this question correctly in its open-ended form.
Some topics lend themselves to a combination of both formats. Religious affiliation is a question that usually is handled in this way. Although a great many religions exist, there are some to which only a few respondents will belong. Thus, we can list religions with large memberships in closed-ended fashion and add the category “other,” where a person can write the name of a religion not on the list (see Question 4 in Table 7.1). We can efficiently handle any question with a similar pattern of responses—numerous possibilities, but only a few popular ones—in this way. The combined format maintains the convenience of closed-ended questions for most of the respondents but also allows those with less common responses to express them.
Table 7.1 Formatting Questions for a Questionnaire
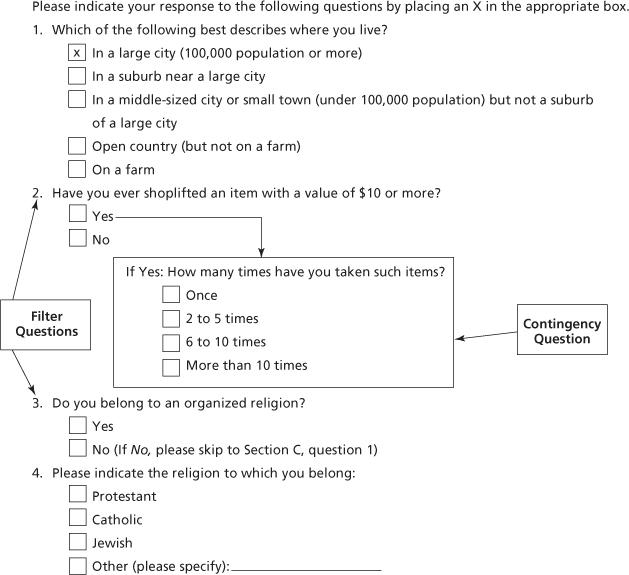
When we use the option of “other” in a closed-ended question, it is a good idea to request that respondents write in their response by indicating “Please specify.” We can then code these answers into whatever response categories seem to be appropriate for data analysis. Researchers should offer the opportunity to specify an alternative, however, even if, for purposes of data analysis, we will not use the written responses. This is done because respondents who hold uncommon views or memberships may be proud of them and desire to express them on the questionnaire. In addition, well-educated professionals tend to react against completely closed-ended questions as too simple, especially when the questions deal with complicated professional matters (Sudman 1985). The opportunity to provide a written response to a question is more satisfying to such respondents, and given this opportunity, they will be more likely to complete the questionnaire.
Another factor in choosing between open- and closed-ended questions is the ease with which we can handle each at the data analysis stage. Open-ended questions sometimes are quite difficult to work with. One difficulty is that poor handwriting or the failure of respondents to provide clear answers can result in data that we cannot analyze (Rea and Parker 2005). Commonly, some responses to open-ended questions just do not make sense, so we end up dropping them from analysis. In addition, open-ended questions are more complicated to analyze by computer, because we must first code a respondent’s answers into a limited set of categories and this coding not only is time-consuming but also can introduce error (see Chapter 14).
Another related difficulty with open-ended questions is that some respondents may give more than one answer to a question. For example, in a study of substance abuse, researchers might ask people why they use—or do not use—alcoholic beverages. As a response to this question, a researcher might receive the following answer: “I quit drinking because booze was too expensive and my wife was getting angry at me for getting drunk.” How should this response be categorized? Should the person be counted as quitting because of the expense or because of the marital problems created by drinking? It may be, of course, that both factors were important in the decision to quit. Researchers usually handle data analysis problems like this in one of two ways: First, the researchers may accept all the individual’s responses as data. This, however, creates difficulties in data analysis; some people give more reasons than others because they are talkative rather than because they actually have more reasons for their behavior. Second, the researchers may handle multiple responses by assuming that each respondent’s first answer is the most important one and considering that answer to be the only response. This assumption, of course, is not always valid, but it does solve the dilemma systematically.
The decision about whether to use open- or closed-ended questions is complex, often requiring considerable experience with survey methods. An important issue, it can have substantial effects on both the type and the quality of the data collected, as illustrated in a survey of attitudes about social problems confronting the United States. The Institute for Social Research at the University of Michigan asked a sample of people open- and closed-ended versions of essentially the same questions (Schuman and Presser 1979). The two versions elicited quite different responses. For example, with the closed-ended version, 35 percent of the respondents indicated that crime and violence were important social problems, compared with only 15.7 percent in the open-ended version. With a number of other issues, people responding to the closed-ended questions were more likely to indicate that particular issues were problems. One reason that the type of question has such an effect on the data is that the list of alternatives in the closed-ended questions tends to serve as a “reminder” to the respondent of issues that might be problems. Without the stimulus of the list, some respondents might not even think of some of these issues. A second reason is that people tend to choose from the list provided in closed-ended questions rather than writing in their own answers, even when provided with an “other” category.
In some cases, researchers can gain the benefits of both open- and closed-ended questions by using an open-ended format in a pretest or pilot study and then, based on these results, designing closed-ended questions for the actual survey.
Wording of Questions
Because the questions that make up a survey are the basic data-gathering devices, researchers need to word them with great care. Especially with questionnaires that allow the respondent no opportunity to clarify questions, ambiguity can cause substantial trouble. We will review some of the major issues in developing good survey questions (Sudman and Bradburn 1982). (In Chapter 13, we will discuss some problems of question construction having to do specifically with questions that are part of multiple-item scales.)
Researchers should subject the wording of questions, whenever possible, to empirical assessment to determine whether a particular wording might lead to unnoticed bias. Words, after all, have connotative meanings—that is, emotional or evaluative associations—that the researcher may not be aware of but that may influence respondents’ answers to questions. In a study of attitudes about social welfare policy in the United States, for example, researchers asked survey respondents whether they believed the government should spend more or less money on welfare (T.W. Smith 1987). Respondents, however, were asked the question in three slightly different ways. One group was asked about whether we were spending too much or too little on “welfare,” a second group about spending too much or too little on “assistance for the poor,” and a third group about money for “caring for the poor.” At first glance, all three questions seem to have much the same meaning, yet people’s responses to them suggested something quite different. Basically, people responded much more negatively to the question with the word “welfare” in it, indicating much less willingness to spend more money on “welfare” compared with spending money to “assist the poor.” For example, 64.7 percent of the respondents indicated that too little was being spent on “assistance to the poor,” but only 19.3 percent said we were spending too little on “welfare.” This is a very dramatic difference in opinion, resulting from what might seem, at first glance, to be a minor difference in wording. Although the study did not investigate why these differing responses occurred, it seems plausible that the word “welfare” has connotative meanings for many people that involve images of laziness, waste, fraud, bureaucracy, or the poor as being disreputable. “Assisting the poor,” on the other hand, is more likely associated with giving and Judeo-Christian charity. These connotations lead to quite different responses. In many cases, the only way to assess such differences is to compare people’s responses with different versions of the same question during a pretest.
In general, researchers should state questions in the present tense. Specialized questions that focus on past experiences or future expectations, however, are an exception. In these situations, researchers should use the appropriate past or future tense. Of major importance is making sure that tenses are not carelessly mixed. Failure to maintain consistent tense of questions can lead to an understandable confusion on the part of respondents and, therefore, to more measurement error.
Researchers should keep questions simple and direct, expressing only one idea, and avoid complex statements that express more than one idea. Consider the following double-negative question that appeared in a Roper Organization poll conducted in 1992 about the Holocaust: “Does it seem possible or does it seem impossible to you that the Nazi extermination of the Jews never happened?” (Smith 1995, p. 269). The results showed that 22 percent said “possible,” 65 percent “impossible,” and 12 percent “don’t know.” Could it be that more than one fifth of Americans had doubts about the Holocaust and more than one third questioned it or were uncertain that it had occurred? Considerable controversy erupted over the survey results. In a subsequent Gallup Poll, researchers asked respondents the same double-negative question with this follow-up question: “Just to clarify, in your opinion, did the Holocaust definitely happen, probably happen, probably not happen, or definitely not happen?” (Smith 1995, p. 277). Of those who had said it was possible that the Holocaust never happened in response to the first question, 97 percent changed their position to say that it did happen with the second question.
Statements that seem to be crystal clear to a researcher may prove to be unclear to many respondents. One common error is to overestimate the reading ability of the average respondent. For example, a national study of adult literacy found that more than 20 percent of adults in the United States demonstrate skills in the lowest level of prose, document, and quantitative literacy proficiencies. At this level, many people cannot total an entry on a deposit slip, identify a piece of specific information in a brief news article, or respond to many of the questions on a survey form (Kirsch et al. 1993). Such limited literacy skills are common among some clients of the human services, especially when English is a second language. Accordingly, the researcher should avoid the use of technical terms on questionnaires. For example, it would not be advisable to include such a statement as “The current stratification system in the United States is too rigid.” The word “stratification” is a technical term in the social sciences that many people outside the field do not understand in the same sense that social scientists do.
Another practice to avoid is making reference to things that we cannot clearly define or that depend on the respondent’s interpretation. For example, “Children who get into trouble typically have had a bad home life” is an undesirable statement, because it includes two sources of vagueness. The word “trouble” is unclear. What kind of trouble? Trouble with the law? Trouble at school? Trouble with parents? The other problem is the phrase “bad home life,” because what constitutes a “bad home life” depends on the respondent’s interpretation.
Finally, for the majority of questions designed for the general public, researchers should never use slang terminology. Slang tends to arise in the context of particular groups and subcultures. Slang terms may have a precise meaning within those groups, but such terms confuse people outside those groups. Occasionally, however, the target population for a survey is more specialized than the general population, and the use of their “in-group” jargon may be appropriate. It would demonstrate to the respondents that the researcher cared enough to “learn their language” and could increase rapport, resulting in better responses. Having decided to use slang, however, the burden is on the researcher to be certain that he or she uses it correctly.
Once a survey instrument is developed, it must be pretested to see if the questions are clearly and properly understood and are unbiased. We can handle pretesting by having people respond to the questionnaire or interview and then reviewing it with them to find any problems. The way that a group responds to the questions themselves also can point out trouble. For example, if many respondents leave a particular answer blank, then there may be a problem with that question. Once the instrument is pretested and modifications are made where called for, the survey should be pretested again. Any change in the questionnaire requires more pretesting. Only when it is pretested with no changes being called for is the questionnaire ready to use in research.
We present these and other problems that can arise in writing good survey questions in Table 7.2. One of the critical decisions in survey research—and it is a complex decision—is whether to collect data through questionnaires or through interviews. We discuss both types of surveys with an eye on the criteria to use in assessing which is more appropriate for a particular research project.
Table 7.2 Common Errors in Writing Questions and Statements
| Original Question | Problem | Solution |
| The city needs more housing for the elderly and property taxes should be raised to finance it. | Two questions in one: Some respondents might agree with the first part but disagree with the second. | Questions should be broken up into two separate statements, each expressing a single idea. |
| In order to build more stealth bombers, the government should raise taxes. | False premise: What if a person doesn’t want more bombers built? How do they answer? | First ask their opinion on whether the bomber should be built; then, for those who respond “Yes,” ask the question about taxes. |
| Are you generally satisfied with your job, or are there some things about it that you don’t like? | Overlapping alternatives: A person might want to answer “Yes” to the first part (i.e., they are generally satisfied) but “No” to the second part (i.e., there are also some things they don’t like). | Divide this into two questions: one measures their level of satisfaction while the other assesses whether there are things they don’t like. |
| How satisfied are you with the number and fairness of the tests in this course? | Double-barreled question: It asks about both the “number” and the “fairness,” and a person might feel differently about each. | Divide this into two questions. |
| What is your income? | Vague and ambiguous words:Does “income” refer to before-tax or after-tax income? To hourly, weekly, monthly, or yearly income? | Clarify: What was your total annual income, before taxes, for the year 2000? |
| Children who get into trouble typically have had a bad home life. | Vague and ambiguous words:The words trouble and bad home life are unclear. Is it trouble with the law, trouble at school, trouble with parents, or what? What constitutes a bad home lifedepends on the respondent’s interpretation. | Clarify: Specify what you mean by the words: troublemeans “having been arrested” and bad home life means “an alcoholic parent.” |
Questionnaires
Questionnaires are designed so that they can be answered without assistance. Of course, if a researcher hands a questionnaire to the respondent, as we sometimes do, the respondent then has the opportunity to ask the researcher to clarify anything that is ambiguous. A good questionnaire, however, should not require such assistance. In fact, researchers often mail questionnaires or send them online to respondents, who thus have no opportunity to ask questions. In other cases, researchers administer questionnaires to many people simultaneously in a classroom, auditorium, or agency setting. Such modes of administration make questionnaires quicker and less expensive than most interviews; however, they place the burden on researchers to design questionnaires that respondents can properly complete without assistance.
Structure and Design
Directions
One of the simplest—but also most important—tasks of questionnaire construction is the inclusion of precise directions for respondents. Good directions go a long way toward improving the quality of data that questionnaires generate. If we want respondents to put an “X” in a box corresponding to their answer, then we tell them to do so. Questionnaires often contain questions requiring different kinds of answers as well, and at each place in the questionnaire where the format changes, we need to include additional directions.
Order of Questions
An element of questionnaire construction that requires careful consideration is the proper ordering of questions. Careless ordering can lead to undesirable consequences, such as a reduced response rate or biased responses to questions. Generally, questions that are asked early in the questionnaire should not bias answers to those questions that come later. For example, if we asked several factual questions regarding poverty and the conditions of the poor, and we later asked a question concerning which social problems people consider to be serious, more respondents will likely include poverty than would otherwise have done so. When a questionnaire contains both factual and opinion questions, we sometimes can avoid these potentially biasing effects by placing opinion questions first.
Ordering of questions also can increase a respondent’s interest in answering a questionnaire—this is especially helpful for boosting response rates with mailed questionnaires. Researchers should ask questions dealing with particularly intriguing issues first. The idea is to interest the recipients enough to get them to start answering, because once they start, they are more likely to complete the entire questionnaire. If the questionnaire does not deal with any topics that are obviously more interesting than others, then opinion questions should be placed first. People like to express their opinions, and for the reasons mentioned earlier, we should put opinion questions first anyway. A pitfall we definitely want to avoid is beginning a questionnaire with the standard demographic questions about age, sex, income, and the like. People are so accustomed to those questions that they may not want to answer them again—and may promptly file the questionnaire in the nearest wastebasket.
Question Formats
All efforts at careful wording and ordering of the questions will be for naught unless we present the questions in a manner that facilitates responding to them. The goal is to make responding to the questions as straightforward and convenient as possible and to reduce the amount of data lost because of responses that we cannot interpret.
When presenting response alternatives for closed-ended questions, we obtain the best results by having respondents indicate their selection by placing an “X” in a box (![]() ) corresponding to that alternative, as illustrated in Question 1 of Table 7.1. This format is preferable to open blanks and check marks (✓), because it is easy for respondents to get sloppy and place check marks between alternatives, rendering their responses unclear and, therefore, useless as data. Boxes force respondents to give unambiguous responses. This may seem to be a minor point, but we can attest from our own experience in administering questionnaires that it makes an important difference.
) corresponding to that alternative, as illustrated in Question 1 of Table 7.1. This format is preferable to open blanks and check marks (✓), because it is easy for respondents to get sloppy and place check marks between alternatives, rendering their responses unclear and, therefore, useless as data. Boxes force respondents to give unambiguous responses. This may seem to be a minor point, but we can attest from our own experience in administering questionnaires that it makes an important difference.
Some questions on a questionnaire may apply to only some respondents and not others. These questions normally are handled by what are called filter questions and contingency questions. A filter question is a question whose answer determines which question the respondent goes to next. In Table 7.1, Questions 2 and 3 are both filter questions. In Question 2, the part of the question asking about “how many items they have taken” is called a contingency question, because whether a person answers it depends on—that is, it is contingent on—his or her answer to the filter question. Notice the two ways in which the filter question is designed with a printed questionnaire. With Question 2, the person answering “Yes” is directed to the next question by the arrow, and the question is clearly set off by a box. Also in the box, the phrase “If Yes” is included to make sure the person realizes that this question is only for those who answered “Yes” to the previous question. With Question 3, the answer “No” is followed by a statement telling the person which question he or she should answer next. Either format is acceptable; the point is to provide clear directions for the respondent. (When questionnaires are designed by special computer programs to be answered on a computer screen or online, the computer program automatically moves the respondent to the appropriate contingency question once the person answers the filter question.) By sectioning the questionnaire on the basis of filter and contingency questions, we can guide the respondent through even the most complex questionnaire. The resulting path that an actual respondent follows through the questionnaire is referred to as the skip pattern. As is true of many aspects of questionnaire design, it is important to evaluate the skip pattern by pretesting the questionnaire to ensure that respondents complete all appropriate sections with a minimum of frustration.
In some cases, a number of questions or statements may all have identical response alternatives. An efficient way of organizing such questions is in the form of a matrix question, which lists the response alternatives only once; a box to check, or a number or letter to circle, follows each question or statement. Table 13.1 on page 350 is an example of a matrix question. Multiple-item indexes and scales often use this compact way of presenting a number of items.
Researchers should use matrix questions cautiously, however, because these questions contain a number of weaknesses. One is that, with a long list of items in a matrix question, it is easy for the respondent to lose track of which line is the response for which statement and, thus, to indicate an answer on the line above or below where the answer should go. Researchers can alleviate this by following every third or fourth item with a blank line so that it is easier visually to keep track of the proper line on which to mark an answer. A second weakness of matrix questions is that they may produce response set. (We will discuss the problem of response set and techniques for alleviating it at length in Chapter 13.) A third weakness of matrix questions is that they may tempt the researcher, to be able to gain the efficiencies of the format, to force the response alternatives of some questions into that matrix format when another format would be more valid. Researchers should determine the response format of any question or statement by theoretical and conceptual considerations of what is the most valid way to measure a variable.
Response Rate
A major problem in many research endeavors is gaining people’s cooperation so that they will provide whatever data are needed. In surveys, we measure cooperation by the response rate, or the proportion of a sample that completes and returns a questionnaire or that agrees to an interview. With interviews, response rates often are very high—in the area of 90 percent—largely because people are reluctant to refuse a face-to-face request for cooperation. In fact, with interviews, the largest nonresponse factor is the inability of the interviewers to locate respondents. With mailed or online questionnaires, however, this personal pressure is absent, and people feel freer to refuse. This can result in many nonreturns, or people who refuse to complete and return a questionnaire. Response rates for questionnaires (especially mailed ones) vary considerably, from an unacceptably low 20 percent to levels that rival those of interviews.
Why is a low response rate of such concern? The issue is the representativeness of a sample, as we discussed in Chapter 6. If we selected a representative sample and obtained a perfect 100 percent response, then we would have confidence in the representativeness of the sample data. As the response rate drops below 100 percent, however, the sample may become less representative. Those who refuse to cooperate may differ in some systematic ways from those who do return the questionnaire that can affect the results of the research. In other words, any response rate less than 100 percent may result in a biased sample. Of course, we rarely achieve a perfect response rate, but the closer the response rate is to that level, the more likely that the data are representative. Researchers can take a number of steps to improve response rates. Most apply only to questionnaires, but we also can use a few of them to increase the response rates in interviews.
A Cover Letter
A properly constructed cover letter can help increase the response rate. A cover letter accompanies a questionnaire and serves to introduce and explain it to the recipient. With mailed or online questionnaires, the cover letter may be the researcher’s only medium for communicating with the recipient, so the researcher must carefully draft the letter to include information that recipients will want to know and to encourage them to complete the questionnaire (see Table 7.3).
Table 7.3 Items to Include in the Cover Letter of a Questionnaire or the Introduction to an Interview
| Item | Cover Letter | Interview Introduction | |||
| 1. | Sponsor of the research | yes | yes | ||
| 2. | Address/phone number of the researcher | yes | if required | ||
| 3. | How the respondent was selected | yes | yes | ||
| 4. | Who else was selected | yes | yes | ||
| 5. | The purpose of the research | yes | yes | ||
| 6. | Who will utilize or benefit from the research | yes | yes | ||
| 7. | An appeal for the person’s cooperation | yes | yes | ||
| 8. | How long it will take the respondent to complete the survey | yes | yes | ||
| 9. | Payment | if given | if given | ||
| 10. | Anonymity/confidentiality | if given | if given | ||
| 11. | Deadline for return | yes | not applicable | ||
Researchers should feature the name of the sponsor of the research project prominently in the cover letter. Recipients want to know who is seeking the information they are being asked to provide, and research clearly indicates that knowledge of the sponsoring organization influences the response rate (Goyder 1985; Rea and Parker 2005). Questionnaires sponsored by governmental agencies receive the highest response rates. University-sponsored research generates somewhat lower response rates. Commercially sponsored research produces the lowest rates of all. Apparently, if the research is at all associated with a governmental agency, stressing that in the cover letter may have a beneficial effect on the response rate. Researchers also can increase the response rates of particular groups if their research is sponsored or endorsed by an organization that people in the group believe has legitimacy. For example, we can increase response rates of professionals if the research is linked to relevant professional organizations, such as the National Association of Social Workers, the American Nurses Association, or the National Education Association (Sudman 1985).
The address and telephone number of the researcher also should appear prominently on the cover letter. In fact, using letterhead stationery for the cover letter is a good idea. Especially if the sponsor of the research is not well known, some recipients may desire further information before they decide to participate. Although relatively few respondents will ask for more information, including the address and telephone number gives the cover letter a completely open and above-board appearance that may further the general cooperation of recipients.
In addition, the cover letter should inform the respondent of how people were selected to receive the questionnaire. It is not necessary to go into great detail on this matter, but people receiving an unanticipated questionnaire are naturally curious about how they were chosen to be part of a study. A brief statement, for example, that they were randomly selected or selected by computer (if this is the case) should suffice.
Recipients also want to know the purpose of the research. Again, without going into great detail, the cover letter should explain why the research is being conducted, why and by whom it is considered to be important, and the potential benefits that are anticipated from the study. Investigations have shown clearly that we can significantly increase the response rate if we emphasize the importance of the research to the respondent. We must word this part of the cover letter carefully, however, so that it does not sensitize respondents in such a way that affects their answers to our questions. We can minimize sensitizing effects by keeping the description of the purpose general—certainly, do not suggest any of the research hypotheses. Regarding the importance of the data and the anticipated benefits, the researcher should resist the temptation of hyperbole and, instead, make honest, straightforward statements. Respondents will see claims about “solving a significant social problem” or “alleviating the problems of the poor” as precisely what they are—exaggerated.
The preceding information provides a foundation for the single most important component of the cover letter—namely, a direct appeal for the recipient’s cooperation. General statements about the importance of the research are no substitute for a personal appeal to the recipient as to why he or she should take time to complete the questionnaire. Respondents must believe that their responses are important to the outcome (as, of course, they are). A statement to the effect that “your views are important to us” is a good approach that stresses the importance of each individual respondent and emphasizes that the questionnaire will allow the expression of opinions, which people like.
The cover letter also should indicate that the respondent will remain anonymous or that the data will be treated as confidential, whichever is the case. “Anonymous” means that no one, including the researcher, can link a particular respondent’s name to his or her questionnaire. “Confidential” means that even though the researcher can match a respondent’s name to his or her questionnaire, the researcher will treat the information collectively and will not link any individuals publicly to their responses.
With mailed questionnaires, two techniques assure anonymity (Sudman 1985). The best is to keep the questionnaire itself completely anonymous, with no identifying numbers or symbols; instead, the respondent gets a separate postcard, including his or her name, to mail back at the same time that he or she mails back the completed questionnaire. This way, the researcher knows who has responded and need not send reminders, yet no one can link a particular respondent’s name with a particular questionnaire. A second way to ensure anonymity is to attach a cover sheet to the questionnaire with an identifying number and assure the respondents that the researcher will remove and destroy the cover sheet once receipt of the questionnaire has been recorded. This second procedure provides less assurance to the respondent, because an unethical researcher might retain the link between questionnaires and their identification numbers. The first procedure, however, is more expensive because of the additional postcard mailing, so a researcher may prefer the second procedure for questionnaires that do not deal with highly sensitive issues that sometimes make respondents more concerned about anonymity. If the material is not highly sensitive, then assurances of confidentiality are adequate to ensure a good return rate. No evidence indicates that assuring anonymity rather than confidentiality increases the response rate in nonsensitive surveys (Moser and Kalton 1972).
Finally, the cover letter should include a deadline for returning the questionnaire—that is, a deadline calculated to take into account mailing time and a few days to complete the questionnaire. The rationale for a fairly tight deadline is that it encourages the recipients to complete the questionnaire soon after they receive it and not set it aside, where they can forget or misplace it.
Payment
Research consistently shows that we also can increase response rates by offering a payment or other incentives as part of the appeal for cooperation and that these incentives need not be large to have a positive effect. Studies find that, depending on the respondents, an incentive of between $2 and $20 can add 10 percent to a response rate (Warriner et al. 1996; Woodruff, Conway, and Edwards 2000). For the greatest effect, researchers should include such payments with the initial mailing instead of promising payment on return of the questionnaire. One study found that including the payment with the questionnaire boosted the return rate by 12 percent over promising payment on the questionnaire’s return (Berry and Kanouse 1987). Researchers have used other types of incentives as well, such as entering each respondent in a lottery or donating to charity for each questionnaire returned, but these have shown mixed results as far as increasing response rates.
Mailing procedures also affect response rates. It almost goes without saying that researchers should supply a stamped, self-addressed envelope for returning the questionnaire to make its return as convenient as possible for the respondent. The type of postage used also affects the response rate, with stamps bringing about a 4 percent higher return rate compared with bulk-printed postage (Yammarino, Skinner, and Childers 1991). Presumably, the stamp makes the questionnaire appear more personal and less like unimportant junk mail. A regular stamped envelope also substantially increases the response rate in comparison with a business reply envelope (Armstrong and Luck 1987).
Follow-Ups
The most important procedural matter affecting response rates is the use of follow-up letters or other contacts. A substantial percentage of those who do not respond to the initial mailing will respond to follow-up contacts. With two follow-ups, researchers can achieve 15 to 20 percent increases over the initial return (James and Bolstein 1990; Woodruff, Conway, and Edwards 2000). Such follow-ups are clearly essential; researchers can do them by telephone, if the budget permits and speed is important. With aggressive follow-ups, the difference in response rates between mailed questionnaires and interviews declines substantially (Goyder 1985).
In general, researchers use two-step follow-ups. Some send follow-up letters to nonrespondents that encourage return of the questionnaire once the response to the initial mailing drops off. This letter should include a restatement of the points in the cover letter, with an additional appeal for cooperation. When response to the first follow-up declines, the researcher then sends a second follow-up to the remaining nonrespondents and includes another copy of the questionnaire in case people have misplaced the original. After two follow-ups, we consider the remaining nonrespondents to be a pretty intransigent lot, because additional follow-ups generate relatively few further responses.
Length and Appearance
Two other factors that affect the rate of response to a mailed questionnaire are the length of the questionnaire and its appearance. As the length increases, the response rate declines. No hard-and-fast rule, however, governs the length of mailed questionnaires. Much depends on the intelligence and literacy of the respondents, the degree of interest in the topic of the questionnaire, and other such matters. It probably is a good idea, though, to keep the questionnaire to less than five pages, requiring no more than 30 minutes to fill out. Researchers must take great care to remove any extraneous questions, or any questions that are not essential to the hypotheses under investigation (Epstein and Tripodi 1977). Although keeping the questionnaire to less than five pages is a general guide, researchers should not strive to achieve this by cramming so much material onto each page that the respondent has difficulty using the instrument—because, as mentioned, the appearance of the questionnaire also is important in generating a high response rate. As discussed earlier, the use of boxed response choices and smooth transitions through contingency questions help make completing the questionnaire easier and more enjoyable for the respondent, which in turn increases the probability that he or she will return it.
Other Influences on Response Rate
Many other factors can work to change response rates. In telephone surveys, for example, the voice and manner of the interviewer can have an important effect (Oksenberg, Coleman, and Cannell 1986). Interviewers with higher-pitched, louder voices and clear, distinct pronunciation have lower refusal rates. The same is true for interviewers who sound competent and upbeat. Reminders of confidentiality, however, can negatively affect the response rate (Frey 1986): If an interviewer reminds a respondent of the confidentiality of the information partway through the interview, the respondent is more likely to refuse to respond to some of the remaining questions compared with someone who does not receive such a reminder. The reminder may work to undo whatever rapport the interviewer has already built up with the respondent.
A survey following all the suggested procedures should yield an acceptably high response rate. Specialized populations may, of course, produce either higher or lower rates. Because so many variables are involved, we offer only rough guidelines for evaluating response rates with mailed questionnaires. The desired response rate is 100 percent, of course. Anything less than 50 percent is highly suspect as far as its representativeness is concerned. Unless some evidence of the representativeness can be presented, we should use great caution when generalizing from such a sample. In fact, it might be best to treat the resulting sample as a non-probability sample from which we cannot make confident generalizations. In terms of what a researcher can expect, response rates in the 60 percent range are good; anything more than 70 percent is very good. Even with these response rates, however, we should use caution about generalizing and check for bias as a result of nonresponse. The bottom line, whether the response rate is high or low, is to report it honestly so that those who are reading the research can judge its generalizability for themselves.
Checking for Bias Due to Nonresponse
Even if researchers obtain a relatively high rate of response, they should investigate possible bias due to nonresponse by determining the extent to which respondents differ from nonrespondents (Groves 2004; Miller and Salkind 2002; Rea and Parker 2005). One common method is to compare the characteristics of the respondents with the characteristics of the population from which they were selected. If a database on the population exists, then we can simplify this job. For example, if researchers are studying a representative sample of welfare recipients in a community, the Department of Social Services is likely to have data regarding age, sex, marital status, level of education, and other characteristics for all welfare recipients in the community. The researchers can compare the respondents with this database on the characteristics for which data have already been collected. A second approach to assessing bias from non-response is to locate a subsample of nonrespondents and interview them. In this way, we can compare the responses to the questionnaire by a representative sample of nonrespondents with those of the respondents. This is the preferred method, because we can measure directly the direction and the extent of any bias that results from nonresponse. It is, however, the most costly and time-consuming approach.
Any check for bias from nonresponse, of course, informs us only about those characteristics on which we make comparisons. It does not prove that the respondents are representative of the whole sample on any other variables—including those that might be of considerable importance to the study. In short, we can gather some information regarding such bias, but in most cases, we cannot prove that bias from nonresponse does not exist.
The proper design of survey instruments is important to collecting valid data. Research in Practice 7.1 describes some of the key elements that are designed into a questionnaire used during an applied research project on the human services.
An Assessment of Questionnaires
Advantages
As a technique of survey research, questionnaires have a number of desirable features. First, they gather data far more inexpensively and quickly than interviews do. Mailed questionnaires require only four to six weeks, whereas obtaining the same data by personal interviews would likely take a minimum of several months. Mailed questionnaires also save the expense of hiring interviewers, interviewer travel, and other costs.
Research in Practice 7.1: Needs Assessment: The Pregnancy Risk Assessment Monitoring System
During the 1980s, policymakers in the United States became increasingly aware of distressing statistics regarding pregnancy risk. For example, although infant mortality rates were declining, they were still distressingly high, and the prevalence of low-birth-weight infants showed little change. At the same time, such maternal behaviors as smoking, drug use, and limited use of prenatal and pediatric care services were recognized as being contributors to this lack of improvement. As a result of these concerns, the Centers for Disease Control and Prevention (CDC) developed the Pregnancy Risk Assessment Monitoring System, or PRAMS (Colley et al. 1999). According to the CDC, the PRAMS survey (actually a questionnaire) is a “surveillance system” that focuses on maternal behaviors and experiences before and during a woman’s pregnancy and during her child’s early infancy. The PRAMS supplements data from vital records for planning and assessing perinatal health programs within states. As of 1999, almost half of all states had grants to participate in the program, which currently covers more than 40 percent of all U.S. births. The PRAMS is an excellent example of how researchers can put the advantages of questionnaires to use in applied research and social policy development.
The survey provides each state with data that are representative of all new mothers in the state. For a sampling frame, the PRAMS relies on eligible birth certificates. Every month, researchers select a stratified sample of 100 to 250 new mothers in each participating state. Once the sample has been selected, the project is persistent in its efforts to reach the potential respondents. The sequence for PRAMS contact is as follows:
Pre-letter. This letter introduces the PRAMS to the sampled mother and informs her that a questionnaire will soon arrive.
Initial Mail Questionnaire Packet. This packet goes to all sampled mothers 3-7 days after the pre-letter. It contains a letter explaining how and why the mother was chosen and eliciting her cooperation. The letter provides instructions for completing the questionnaire, explains any incentive or reward provided, and includes a telephone number that she may call for additional information. The questionnaire booklet itself is 14 pages long, with an attractive cover and an extra page for the mother’s comments. A question-and-answer brochure contains additional information to help convince the mother to complete the questionnaire and a calendar to serve as a memory aid when answering the survey questions. Finally, the packet contains a participation incentive, such as coupons for birth certificates, a raffle for a cash award, postage stamps, bibs, or other inexpensive items.
Tickler. The tickler serves as a thank-you/reminder note and is sent 7-10 days after the initial mail packet.
Second Mail Questionnaire Packet. This packet is sent 7-14 days after the tickler to all sampled mothers who did not respond.
Third Mail Questionnaire Packet (Optional). This third packet goes to all remaining nonrespondents 7-14 days after the second questionnaire.
Telephone Follow-Up. Researchers initiate telephone follow-up for all nonrespondents 7-14 days after mailing the last questionnaire.
For 1997, the PRAMS reported survey response rates that ranged from a low of 69 percent for West Virginia to a high of 80 percent for Maine.
Because the PRAMS data are based on good samples that are drawn from the whole population, we can generalize findings from its data analyses to an entire state’s population of women having live births. The questionnaire consists of a core component and a state-specific component that can ask questions addressing the particular data needs of a state.
According to the CDC, findings from analysis of the PRAMS data have enhanced states’ understanding of maternal behaviors and experiences as well as their relationship with adverse pregnancy outcomes. Thus, these data are used to develop and assess programs and policies designed to reduce those outcomes. Some states have participated since 1987, and continuous data collection also permits states to monitor trends in key indicators over time. For example, one specific topic about which participants are queried is infant sleep position, because infants who sleep on their backs are less susceptible to Sudden Infant Death Syndrome. Analysis of the data from 1996 to 1997 indicated that 6 of the 10 participating states reported a significant decrease in the prevalence of the stomach (prone) sleeping position.
In addition to illustrating the principles of sound survey design in action, the PRAMS project demonstrates the value of survey research as a tool in applied research. Although the data the PRAMS generates certainly may be of use in expanding our knowledge of human behavior, its primary role is as a tool for informing social policy, identifying needs requiring intervention, and assessing progress toward meeting policy objectives. Readers who would like to learn more about this project should go to the CDC’s Division of Reproductive Health Web site (www.cdc.gov/reproductivehealth/DRH).
Second, mailed questionnaires enable the researcher to collect data from a geographically dispersed sample. It costs no more to mail a questionnaire across the country than it does to mail a questionnaire across the city. Costs of interviewer travel, however, rise enormously as the distance increases, making interviews over wide geographic areas an expensive process.
Third, with questions of a personal or sensitive nature, mailed questionnaires may provide more accurate answers than interviews. People may be more likely to respond honestly to such questions when they are not face to face with a person who they perceive as possibly making judgments about them. In practice, researchers may use a combination of questionnaires and interviews to address this problem. Written questions, or computer-assisted self-interviewing, has been proven to generate more accurate information (Newman et al. 2002). In addition, a self-administered questionnaire increased reporting of male-to-male sexual activity over standard interview procedures in the General Social Survey (Anderson and Stall 2002).
Finally, mailed questionnaires eliminate the problem of interviewer bias, which occurs when an interviewer influences a person’s response to a question by what he or she says, his or her tone of voice, or his or her demeanor. Because no interviewer is present when the respondent fills out the questionnaire, an interviewer cannot bias the answers to a questionnaire in any particular direction (Cannell and Kahn 1968).
Disadvantages
Despite their many advantages, mailed questionnaires have important limitations that may make them less desirable for some research efforts (Moser and Kalton 1972). First, mailed questionnaires require a minimal degree of literacy and facility in English, which some respondents may not possess. Substantial nonresponse is, of course, likely with such people. Nonresponse because of illiteracy, however, does not seriously bias the results of most general-population surveys. Self-administered questionnaires are more successful among people who are better educated, motivated to respond, and involved in issues and organizations. Often, however, some groups of interest to human service practitioners do not possess these characteristics. If the survey is aimed at a special population in which the researcher suspects lower-than-average literacy, personal interviews are a better choice.
Second, all the questions must be sufficiently easy to comprehend on the basis of printed instructions. Third, there is no opportunity to probe for more information or to evaluate the nonverbal behavior of the respondents. The answers they mark on the questionnaire are final. Fourth, the researcher has no assurance that the person who should answer the questionnaire is the one who actually does. Fifth, the researcher cannot consider responses to be independent, because the respondent can read through the entire questionnaire before completing it. Finally, all mailed questionnaires face the problem of nonresponse bias.
Interviews
During an interview, the investigator or an assistant reads the questions directly to the respondents and then records their answers. Interviews offer the investigator a degree of flexibility that is not available with questionnaires. One area of increased flexibility relates to the degree of structure built into an interview.
The Structure of Interviews
The element of structure in interviews refers to the degree of freedom that the interviewer has in conducting the interview and that respondents have in answering questions. We classify interviews in terms of three levels of structure: (1) unstandardized, (2) nonschedule-standardized, and (3) schedule-standardized.
The unstandardized interview has the least structure. All the interviewer typically has for guidance is a general topic area, as illustrated in Figure 7.1. By developing his or her own questions and probes as the interview progresses, the interviewer explores the topic with the respondent. The approach is called “unstandardized” because each interviewer asks different questions and obtains different information from each respondent. There is heavy reliance on the skills of the interviewer to ask good questions and to keep the interview going; this can only be done if experienced interviewers are available. This unstructured approach makes unstandardized interviewing especially appropriate for exploratory research. In Figure 7.1, for example, only the general topic of parent—child conflicts guides the interviewer. The example also illustrates the suitability of this style of interviewing for exploratory research, where the interviewer is directed to search for as many areas of conflict as can be found.
Figure 7.1 Examples of Various Interviewer Structures
| The Unstandardized Interview | |||||||||
| Instructions to the interviewer: Discover the kinds of conflicts that the child has had with the parents. Conflicts should include disagreements, tensions due to past, present, or potential disagreements, outright arguments and physical conflicts. Be alert for as many categories and examples of conflicts and tensions as possible. | |||||||||
| The Nonschedule-Standardized Interview | |||||||||
| Instructions to the interviewer: Your task is to discover as many specific kinds of conflicts and tensions between child and parent as possible. The more concreteand detailed the account of each type of conflict the better. Although there are 12 areas of possible conflict which we want to explore (listed in question 3 below), you should not mention any area until after you have asked the first two questions in the order indicated. The first question takes an indirect approach, giving you time to build up a rapport with the respondent and to demonstrate a nonjudgmental attitude toward teenagers who have conflicts with their parents.
(Possible probes: Do they always agree with their parents? Do any of your friends have “problem parents”? What other kinds of disagreements do they have?)
(Possible probes: Do they cause you any problems? In what ways do they try to restrict you? Do you always agree with them on everything? Do they like the same things you do? Do they try to get you to do some things you don’t like? Do they ever bore you? Make you mad? Do they understand you? etc.)
| |||||||||
| The Schedule-Standardized Interview | |||||||||
| Interviewer’s explanation to the teenage respondent: We are interested in the kinds of problems teenagers have with their parents. We need to know how many teenagers have which kinds of conflicts with their parents and whether they are just mild disagreements or serious fights. We have a checklist here of some of the kinds of things that happen. Would you think about your own situation and put a check to show which conflicts you, personally, have had and about how often they have happened? Be sure to put a check in every row. If you have never had such a conflict then put the check in the first column where it says “never.” | |||||||||
| (Hand him the first card dealing with conflicts over the use of the automobile, saying, “If you don’t understand any of those things listed or have some other things you would like to mention about how you disagree with your parents over the automobile let me know and we’ll talk about it.”) (When the respondent finishes checking all rows, hand him card number 2, saying, “Here is a list of types of conflicts teenagers have with their parents over their friends of the same sex. Do the same with this as you did the last list.”) | |||||||||
| Automobile | Never | Only Once | More Than Once | Many Times | |||||
| 1. | Wanting to learn to drive |
|
|
|
| ||||
| 2. | Getting a driver’s license |
|
|
|
| ||||
| 3. | Wanting to use the family car |
|
|
|
| ||||
| 4. | What you use the car for |
|
|
|
| ||||
| 5. | The way you drive it |
|
|
|
| ||||
| 6. | Using it too much |
|
|
|
| ||||
| 7. | Keeping the car clean |
|
|
|
| ||||
| 8. | Putting gas or oil in the car |
|
|
|
| ||||
| 9. | Repairing the car |
|
|
|
| ||||
| 10. | Driving someone else’s car |
|
|
|
| ||||
| 11. | Wanting to own a car |
|
|
|
| ||||
| 12. | The way you drive your own car |
|
|
|
| ||||
| 13. | What you use your car for |
|
|
|
| ||||
| 14. | Other |
|
|
|
| ||||
SOURCE: From Raymond L. Gorden, Interviewing: Strategy, Techniques, and Tactics, 4th ed. Copyright © 1987 by the Dorsey Press. Reprinted by permission of the estate of Raymond Gorden.
Nonschedule-standardized interviews add more structure, with a narrower topic and specific questions asked of all respondents. The interview, however, remains fairly conversational; the interviewer is free to probe, to rephrase questions, or to ask the questions in whatever order best fits that particular interview. Note in Figure 7.1 that specific questions are of the open-ended type, allowing the respondent full freedom of expression. As in the case of the unstandardized form, success with this type of interview requires an experienced interviewer.
The schedule-standardized interview is the most structured type. An interview schedule contains specific instructions for the interviewer, specific questions to be asked in a fixed order, and transition phrases for the interviewer to use. Sometimes, the schedule also contains acceptable rephrasings for questions and a selection of stock probes. Schedule-standardized interviews are fairly rigid, with neither interviewer nor respondent allowed to depart from the structure of the schedule. Although some questions may be open-ended, most are closed-ended. In fact, some schedule-standardized interviews are quite similar to a questionnaire, except that the interviewer asks the questions rather than having the respondent read them. In Figure 7.1, note the use of cards with response alternatives handed to the respondent. This is a popular way of supplying respondents with a complex set of closed-ended alternatives. Note also the precise directions for the interviewer as well as verbatim phrases to read to the respondent. Relatively untrained, part-time interviewers can conduct schedule-standardized interviews, because the schedule contains nearly everything they need to say. This makes schedule-standardized interviews the preferred choice for studies with large sample sizes and many interviewers. The structure of these interviews also ensures that all respondents receive the same questions in the same order. This heightens reliability and makes schedule-standardized interviews popular for rigorous hypothesis testing. Research in Practice 7.2 explores some further advantages of having more or less structure in an interview.
Contacting Respondents
As with researchers who mail questionnaires, those who rely on interviewers face the problem of contacting respondents and eliciting their cooperation. Many interviews are conducted in the homes of the respondents; locating and traveling to respondents’ homes are two of the more troublesome—and costly—aspects of interviewing. It has been estimated that as much as 40 percent of a typical interviewer’s time is spent traveling (Sudman 1965). Because so much time and cost are involved, and because researchers desire high response rates, they direct substantial efforts at minimizing the rate of refusal. The first contact of prospective respondents has a substantial impact on the refusal rate.
Research in Practice 7.2: Needs Assessment: Merging Quantitative and Qualitative Measures
That survey research is necessarily quantitative in nature probably is a common misconception. Virtually every edition of the evening news presents the results from one or more surveys, indicating that a certain percentage of respondents hold a given opinion or plan to vote for a particular candidate, or offers other information that is basically quantitative or reduced to numbers. However, survey research is not limited to quantitative analysis. In fact, as we noted in the discussion of Figure 7.1, interviews run the gamut from totally quantitative in the highly structured type to fully qualitative in the least structured variety—as well as any combination in between. Some researchers combine both quantitative and qualitative measures in individual studies to obtain the benefits of each approach.
Two studies of homeless families headed by females illustrate such a merging of interview styles. Shirley Thrasher and Carol Mowbray (1995) interviewed 15 homeless families from three shelters, focusing primarily on the experiences of the mothers and their efforts to take care of their children. Elizabeth Timberlake (1994) based her study on interviews with 200 families not in shelters and focused predominantly on the experiences of the homeless children. In both studies, the researchers used structured interview questions to provide quantitative demographic information about the homeless families, such as their race/ethnicity, length of homelessness, and employment status.
As important as this quantitative information might be, the researchers in both studies wanted to get at the more personal meaning of—and feelings about—being homeless. For this, they turned to the unstructured parts of the interviews (sometimes called ethnographic interviews), which were designed to get the subjects to tell their stories in their own words. The goal of both studies was to assess the needs of the homeless families either to develop new programs to assist them or to modify existing programs to better fit their needs. The researchers felt that the best way to accomplish this goal was to get the story of being homeless, in as pure a form as possible, from the people who lived it, and without any distortion by the researchers’ preconceived notions. The open-ended questions that Timberlake asked the homeless children illustrate this unstructured approach: “Tell me about not having a place to live.” “What is it like?” “What do you do?” “How do you feel?” “How do you handle being homeless?” “Are there things that you do or say?” The questions that Thrasher and Mowbray asked the homeless mothers were similar. Both studies used probes as needed to elicit greater response and to clarify vague responses.
An example from Thrasher and Mowbray illustrates how responses to open-ended questions provide insight into what the respondent is experiencing. Those researchers found that a common experience of the women in the shelters was that, before coming to the shelter, they had bounced around among friends and relatives, experiencing a series of short-term and unstable living arrangements. The researchers present the following quote from 19-year-old “Nancy”:
I went from friend to friend before going back to my mother and her boyfriend. And all my friends they live with their parents, and so you know, I could only stay like a night, maybe two nights before I had to leave. So, the only thing I could do was to come here to the shelter and so that’s what I did. After all, there is only so many friends. I went to live once with my grandmother for a week who lives in a senior citizens’ high rise. But they don’t allow anyone to stay there longer than a week as a visitor. So, I had to move on. I finally went to my social worker and told her I don’t have any place to stay. She put me in a motel first because there was no opening in the shelter. Then I came here.
As this example illustrates, there is no substitute for hearing the plight of these people in their own words to help those who are not homeless gain some understanding of what it is like not to have a stable place to call home.
In part because of her much larger sample, Timberlake did not tape-record her interviews and so made no verbatim transcripts. Instead, she took field notes that summarized the responses of the homeless children. This resulted in a different approach to analysis, because she did not have the long narratives that Thrasher and Mowbray had. Instead, she had a large number of summarized statements from her notes. She ended up doing a more quantitative analysis by categorizing the respondents’ statements into more abstract categories. Timberlake found that the responses clustered around three themes: separation/loss, care-taking/nurturance, and security/protection. Within each theme were statements along two dimensions, which Timberlake refers to as “deprivation” and “restoration,” respectively—the negative statements about what is bad about being homeless, and the positive statements about what the children still have and how they cope. So, children’s statements such as “we got no food” and “Daddy left us” were categorized as reflecting deprivation related to caretaking/nurturance. “Mama stays with us” and “I still got my clothes” were seen to reflect restoration related to separation/loss. Timberlake tabulated the number of each kind of statement. It seems rather indicative of the devastation of homelessness on the children that Timberlake found approximately three times as many deprivation statements as she did restoration statements. It is important to note that these categories and themes were not used by the respondents themselves but were created by Timberlake in an effort to extract some abstract or theoretical meaning from the narratives.
Neither of these studies used an interview format that would be suitable for interviewing a large, randomly selected sample of homeless people with the purpose of estimating the demographic characteristics of the entire homeless population. Imagine trying to organize and summarize data from several thousand interviews like those conducted by Thrasher and Mowbray! To reasonably accomplish such a population estimate, a schedule-standardized interview format, producing quantitative data, is far more appropriate. If the goal of the research project is to gain an understanding of the personal experiences and reactions to being homeless, however, as in the two studies just discussed, then presenting results in the respondents’ own words is more effective. However, if researchers wanted to design a schedule-standardized survey project to do a population description of the homeless, studies such as the two discussed here would be invaluable for determining what concepts to measure and for developing the quantitative indicators that such a study would demand.
These two studies illustrate that both qualitative and quantitative approaches are essential to social research. Which approach is most appropriate in a given situation depends on the particular goals of the research; in some cases, a blend of both quantitative and qualitative approaches in the same project obtains the desired results.
Two approaches to contacting respondents that might appear logical to the neophyte researcher have, in fact, an effect opposite of that desired. It might seem that telephoning to set up an appointment for the interview is a good idea. In reality, telephoning greatly increases the rate of refusal. In one experiment, for example, the part of the sample that was telephoned had nearly triplethe rate of refusal of those who were contacted in person (Brunner and Carroll 1967). Apparently, it is much easier to refuse over the relatively impersonal medium of the telephone than in a face-to-face encounter with an interviewer. Sending people a letterasking them to participate in an interview has much the same effect (Cartwright and Tucker 1967). The letter seems to give people sufficient time before the interviewer arrives to develop reasons why they do not want to cooperate. Those first contacted in person, on the other hand, have only those excuses they can muster on the spur of the moment. Clearly, then, interviewers obtain the lowest refusal rates by contacting interviewees in person.
Additional factors also can affect the refusal rate (Gorden 1987). For example, information regarding the research project should blanket the total survey population through the news media to demonstrate general community acceptance of the project. With a few differences, information provided to the media should contain essentially the same information as provided in a cover letter for a mailed questionnaire (see Table 7.3). Pictures of the interviewers and mention of any equipment they carry, such as laptop computers or video or audio recording devices, should be included. This information assists people in identifying interviewers and reduces possible confusion of interviewers with salespeople or solicitors. In fact, it is a good idea to equip the interviewers with identification badges or something else that is easily recognizable so that they are not mistaken for others who go door to door. When the interviewers go into the field, they should take along copies of the news coverage as well. Then, if they encounter a respondent who has not seen the media coverage, they can show the clippings during the initial contact.
The timing of the initial contact also affects the refusal rate. It is preferable to contact interviewees at a time that is convenient for them to complete the interview without the need for a second call. Depending on the nature of the sample, predicting availability may be fairly easy or virtually impossible. For example, if interviewers can obtain the information that is required from any household member, then almost any reasonable time of day will do. On the other hand, if the interviewer must contact specific individuals, then timing becomes more critical. If we must interview the breadwinner in a household, for example, then we probably should make the contacts at night or on weekends (unless knowledge of the person’s occupation suggests a different time of greater availability). Whatever time the interviewer makes the initial contact, however, it still may not be convenient for the respondent, especially if the interview is lengthy. If the respondent is pressed for time, use the initial contact to establish rapport, and set another time for the interview. Even though callbacks are costly, this is certainly preferable to the rushed interview that results in inferior data.
When the interviewer and potential respondent first meet, the interviewer should include certain points of information in the introduction. One suggestion is the following (Smith 1981):
Good day. I am from the Public Opinion Survey Unit of the University of Missouri (shows official identification). We are doing a survey at this time on how people feel about police-community relationships. This study is being done throughout the state, and the results will be used by local and state governments. The addresses at which we interview are chosen entirely by chance, and the interview only takes 45 minutes. All information is entirely confidential, of course.
Respondents will be looking for much the same basic information about the survey as they do with mailed questionnaires. As the preceding example illustrates, interviewers also should inform respondents of the approximate length of the interview. After the introduction, the interviewer should be prepared to elaborate on any points the interviewee questions. To avoid biasing responses, however, the interviewer must exercise care when discussing the purpose of the survey.
Conducting an Interview
A large-scale survey with an adequate budget often turns to private research agencies to train interviewers and conduct interviews. Often, however, smaller research projects cannot afford this and have to train and coordinate their own team of interviewers, possibly with the researchers themselves doing some of the interviewing. It is important, therefore, to know how to conduct an interview properly.
The Interview as a Social Relationship
The interview is a social relationship designed to exchange information between the respondent and the interviewer. The quantity and quality of information exchanged depend on how astute and creative the interviewer is at understanding and managing that relationship (Fowler and Mangione 1990; Holstein and Gubrium 2003). Human service workers generally are knowledgeable regarding the properties and processes of social interaction; in fact, much human service practice is founded on the establishment of social relationships with clients. A few elements of the research interview, however, are worth emphasizing, because they have direct implications for conducting interviews.
A research interview is a secondary relationship in which the interviewer has a practical, utilitarian goal. It is easy, especially for an inexperienced interviewer, to be drawn into a more casual or personal interchange with the respondent. Especially with a friendly, outgoing respondent, the conversation might drift off to topics like sports, politics, or children. That, however, is not the purpose of the interview. The goal is not to make friends or to give the respondent a sympathetic ear but, rather, to collect complete and unbiased data following the interview schedule.
We all recognize the powerful impact that first impressions have on perceptions. This is especially true during interview situations, in which the interviewer and the respondent are likely to be total strangers. The first impressions that affect a respondent are the physical and social characteristics of the interviewer. So, we need to take considerable care to ensure that the first contact enhances the likelihood of the respondent’s cooperation (Warwick and Lininger 1975). Most research suggests that interviewers are more successful if they have social characteristics similar to those of their respondents. Thus, such characteristics as socioeconomic status, age, sex, race, and ethnicity might influence the success of the interview—especially if the subject matter of the interview relates to one of these topics. In addition, the personal demeanor of the interviewer plays an important role; interviewers should be neat, clean, and businesslike but friendly.
After exchanging initial pleasantries, the interviewer should begin the interview. The respondent may be a bit apprehensive during the initial stages of an interview. In recognition of this, the interview should begin with fairly simple, nonthreatening questions. A schedule, if used, should begin with these kinds of questions. The demographic questions, which are reserved until the later stages of a mailed questionnaire, are good to begin an interview. The familiarity of respondents with this information makes these questions nonthreatening and a good means of reducing tension in the respondent.
Probes
If an interview schedule is used, then the interview progresses in accordance with it. As needed, the interviewer uses probes, or follow-up questions, intended to elicit clearer and more complete responses. In some cases, the interview schedule contains suggestions for probes. In less-structured interviews, however, interviewers must develop and use their own probes. These probes can take the form of a pause in conversation that encourages the respondent to elaborate or an explicit request to clarify or elaborate on something. A major concern with any probe is that it not bias the respondent’s answer by suggesting the answer (Fowler and Mangione 1990).
Recording Responses
A central task of interviewers, of course, is to record the responses of respondents. The four most common ways are classifying responses into predetermined categories, summarizing key points, taking verbatim notes (by hand writing or with a laptop computer), or making an audio or video recording of the interview.
Recording responses generally is easiest when we use an interview schedule. Because closed-ended questions are typical of such schedules, we can simply classify responses into the predetermined alternatives. This simplicity of recording is another factor making schedule-standardized interviews suitable for use with relatively untrained interviewers, because no special recording skills are required.
With nonschedule-standardized interviewing, the questions are likely to be open-ended and the responses longer. Often, all we need to record are the key points the respondent makes. The interviewer condenses and summarizes what the respondent says. This requires an experienced interviewer who is familiar with the research questions who can accurately identify what to record and then do so without injecting his or her own interpretation, which would bias the summary.
Sometimes, we may want to record everything the respondent says verbatim to avoid the possible biasing effect of summarizing responses. If the anticipated responses are reasonably short, then competent interviewers can take verbatim notes. Special skills, such as shorthand, may be necessary. If the responses are lengthy, then verbatim note taking can cause difficulties, such as leading the interviewer to fail to monitor the respondent or to be unprepared to probe when necessary. It also can damage rapport by making it appear that the interviewer is ignoring the respondent. Making audio or video recordings of the interviews can eliminate problems such as this but also can increase the costs substantially, both for the equipment and for later transcription of the materials (Gorden 1987). Such recordings, however, also provide the most accurate account of the interview.
The fear some researchers have that tape recorders increase the refusal rate appears to be unwarranted (Gorden 1987). If the recorder is explained as a routine procedure that aids in capturing complete and accurate responses, few respondents object.
Controlling Interviewers
Once interviewers go into the field, the quality of the resulting data depends heavily on them. It is a naive researcher, indeed, who assumes that, without supervision, they will all do their job properly, especially when part-time interviewers who have little commitment to the research project are used. Proper supervision begins during interviewer training by stressing the importance of contacting the right respondents and meticulously following established procedures.
Although sloppy, careless work is one concern, a more serious issue is interviewer falsification, or the intentional departure from the designed interviewer instructions, unreported by the interviewer, which can result in the contamination of data (American Association for Public Opinion Research Standards Committee 2003). A dramatic illustration of this was discovered in a National Institutes of Health (NIH) survey of AIDS and other sexually transmitted diseases (Marshall 2000). Eleven months into the study, a data-collection manager was troubled by the apparent overproductivity of one interviewer. A closer look revealed that, although the worker was submitting completed interviews, some were clearly falsified. For example, the address of one interview site turned out to be an abandoned house. The worker was dismissed, and others came under suspicion. It took months to root out what was referred to as an “epidemic of falsification” on this research project. A cessation of random quality checks was identified as a major contributing factor to the problem.
Falsified data is believed to be rare, but survey organizations take this problem seriously and follow established procedures to address it. Factors that contribute to falsification include pressure on interviewers to obtain very high response rates and the use of long, complicated questionnaires that may frustrate both interviewer and respondent. The problem can be prevented by careful recruitment, screening, and training of interviewers; by recognizing incentives for falsification created by work quotas and pay structures; and by monitoring and verifying interviewer work (Bushery et al. 1999).
Minorities and the Interview Relationship
Many respondents in surveys have different characteristics than those of the interviewers. Does it make a difference in terms of the quantity or quality of data collected in surveys when the interviewer and the interviewee have different characteristics? It appears that it does. In survey research, three elements interact to affect the quality of the data collected: (1) minority status of the interviewer, (2) minority status of the respondent, and (3) minority content of the survey instrument. Researchers should carefully consider the interrelationships among these elements to ensure that the least amount of bias enters the data-collection process.
As we have emphasized, an interview is a social relationship in which the interviewer and the respondent have cultural and subcultural expectations for appropriate behavior. One set of expectations that comes into play is the social desirability of respondents’ answers to questions. Substantial research documents a tendency for people to choose more desirable or socially acceptable answers to questions in surveys (DeMaio 1984; Holstein and Gubrium 2003), in part from the desire to appear sensible, reasonable, and pleasant to the interviewer. In all interpersonal contacts, including an interview relationship, people typically prefer to please someone rather than to offend or alienate. For cases in which the interviewer and the respondent are from different racial, ethnic, or sexual groups, respondents tend to give answers that they perceive to be more desirable—or, at least, less offensive—to the interviewer; this is especially true when the questions are related to racial, ethnic, or sexual issues. A second set of expectations that comes into play and affects responses during interviews is the social distance between the interviewer and the respondent, or how much they differ from each other on important social dimensions, such as age or minority status. Generally, the less social distance between people, the more freely, openly, and honestly they will talk. Racial, sexual, and ethnic differences often indicate a degree of social distance.
The impact of cross-race interviewing has been studied extensively with African-American and white respondents (Anderson, Silver, and Abramson 1988; Bachman and O’Malley 1984; Bradburn and Sudman 1979; Dailey and Claus 2001). African-American respondents, for example, express more warmth and closeness for whites when interviewed by a white person and are less likely to express dissatisfaction or resentment over discrimination or inequities against African Americans. White respondents tend to express more pro-black attitudes when the interviewer is African American. This race-of-interviewer effect can be quite large, and it occurs fairly consistently. Some research concludes that it plays a role mostly when the questions involve race or other sensitive topics, but recent research suggests that its effect is more pervasive, affecting people’s responses to many questions on a survey, not just the racial or sensitive questions (Davis 1997).
Fewer researchers have studied the impact of ethnicity on interviews, probably because in most cases, the ethnicity of both the interviewer and the respondent is not as readily apparent as is race, which is visibly signified by skin color. In one study, both Jewish and non-Jewish interviewers asked questions about the extent of Jewish influence in the United States (Hyman 1954). Respondents were much more willing to say that Jews had too much influence when they were being interviewed by a non-Jew.
Gender has an effect on interviews as well. Women are much more likely to report honestly about such topics as rape, battering, sexual behavior, and male—female relationships in general when women interview them instead of men (Eichler 1988; Reinharz 1992). In a study of sexual behaviors with Latino couples, men reported fewer sexual partners and were less likely to report sex with strangers when they were interviewed by women than when they were interviewed by other men; male respondents also were more likely to report sex with prostitutes or other men to older interviewers than to younger interviewers. Women were less likely to report oral sex to older interviewers (Wilson et al. 2002).
Some researchers recommend routinely matching interviewer and respondent for race, ethnicity, or gender in interviews on racial or sensitive topics, and this generally is sound advice. Sometimes, however, a little more thought is called for. The problem is that we are not always sure in which direction bias might occur. If white respondents give different answers to white as opposed to black interviewers, which of their answers most accurately reflect their attitudes? For the most part, we aren’t sure. We generally assume that same-race interviewers gather more accurate data (Fowler and Mangione 1990). A more conservative assumption, however, is that the truth falls somewhere between the data that the two interviewers of different race collect.
When minorities speak a language different from that of the dominant group, conducting the interview in the dominant group’s language can affect the quality of data collected (Marin and VanOss Marin 1991). For example, a study of Native-American children in Canada found that these children expressed a strong white bias in racial preferences when the study was conducted in English; however, this bias declined significantly when interviewers used the children’s native Ojibwa language (Annis and Corenblum 1986). This impact of language should not be surprising, considering that language is not just a mechanism for communication but also reflects cultural values, norms, and a way of life. So, when interviewing groups in which a language other than English is widely used, it is appropriate to consider conducting the interviews in that other language.
An Assessment of Interviews
Advantages
Personal interviews have several advantages compared with other data-collection techniques. First, interviews can help motivaterespondents to give more accurate and complete information. Respondents have little motivation to be accurate or complete when responding to a mailed questionnaire; they can hurry through it if they want to. The control that an interviewer affords, however, encourages better responses, which is especially important as the information sought becomes more complex.
Second, interviewing offers an opportunity to explain questions that respondents may not otherwise understand. Again, if the information being sought is complex, then this can be of great importance, and interviews virtually eliminate the literacy problem that may accompany mailed questionnaires. Even lack of facility in English can be handled with multilingual interviewers. (When we conducted a needs assessment survey in some rural parts of Michigan’s Upper Peninsula several years ago, we employed one interviewer who was fluent in Finnish, because a number of people in the area spoke Finnish but little or no English.)
Third, the presence of an interviewer allows control over factors that are uncontrollable with mailed questionnaires. For example, the interviewer can ensure not only that the proper person responds to the questions but also that he or she does so in sequence. Furthermore, the interviewer can arrange to conduct the interview so that the respondent does not consult with and is not influenced by other people before responding.
Fourth, interviewing is a more flexible form of data collection than questionnaires. The style of interviewing can be tailored to the needs of the study. A free, conversational style, with much probing, can be adopted in an exploratory study. In a more developed study, a highly structured approach can be used. This flexibility makes interviewing suitable for a far broader range of research situations compared with mailed questionnaires.
Finally, the interviewer can add observational information to the responses. What was the respondent’s attitude toward the interview? Was he or she cooperative? Indifferent? Hostile? Did the respondent appear to fabricate answers? Did he or she react emotionally to some questions? This additional information helps us better evaluate the responses, especially when the subject matter is highly personal or controversial (Gorden 1987).
Disadvantages
Some disadvantages associated with personal interviews may lead the researcher to choose another data-collection technique. The first disadvantage is cost. Researchers must hire, train, and equip interviewers and also pay for their travel. All these expenses are costly.
The second limitation is time. Traveling to respondents’ homes requires a lot of time and limits each interviewer to only a few interviews each day. In addition, to contact particular individuals, an interviewer may require several time-consuming callbacks. Project start-up operations, such as developing questions, designing schedules, and training interviewers, also require considerable time.
A third limitation of interviews is the problem of interviewer bias. Especially in unstructured interviews, the interviewers may misinterpret or misrecord something because of their personal feelings about the topic. Furthermore, just as the interviewer’s characteristics affect the respondent, so the characteristics of the respondent similarly affect the interviewer. Sex, age, race, social class, and a host of other factors may subtly shape the way in which the interviewer asks questions and interprets the respondent’s answers.
A fourth limitation of interviews, especially less structured interviews, is the possibility of significant but unnoticed variation in wording either from one interview to the next or from one interviewer to the next. We know that variations in wording can produce variations in response, and the more freedom that interviewers have in this regard, the more of a problem this is. Wording variation can affect both reliability and validity (see Chapter 5).
Telephone Surveys
Face-to-face interviews tend to be a considerably more expensive means of gathering data than either mailed questionnaires or telephone surveys (Rea and Parker 2005). As Table 7.4 shows, face-to-face interviews can be more than twice as expensive as phone or mail surveys. The table shows that face-to-face interviews incur substantially higher costs for locating residences, contacting respondents, conducting interviews, traveling, and training interviewers. Mail or telephone surveys require no travel time, fewer interviewers, and fewer supervisory personnel. Although telephone charges are higher in telephone surveys, these costs are far outweighed by other savings. The cost advantages of the less-expensive types of surveys make feasible much research that otherwise would be prohibitively expensive.
Table 7.4 Cost Comparison of Telephone, Mail, and Face-to-Face Surveys, with a Sample Size of 520
| A. Mail Survey | Total Cost (dollars) | ||||
| Prepare for survey |
| ||||
|
| Purchase sample list in machine-readable form | 375 | |||
| Load database of names and addresses | 17 | ||||
| Graphic design for questionnaire cover (hire out) | 100 | ||||
| Print questionnaires: 4 sheets, legal-size, folded, 1,350 @ $.15 each (includes paper) (hire out) | 203 | ||||
| Telephone | 100 | ||||
| Supplies |
| ||||
|
| Mail-out envelopes, 2,310 @ $.05 each, with return address | 116 | |||
|
| Return envelopes, 1,350 @ $.05 each, pre-addressed but no return address | 68 | |||
|
| Letterhead for cover letters, 2,310 @ $.05 each | 116 | |||
|
|
| Miscellaneous | 200 | ||
| First mail-out (960) |
| ||||
|
| Print advance-notice letter | 25 | |||
|
| Address envelopes | 25 | |||
|
| Sign letters, stamp envelopes | 50 | |||
|
| Postage for mail-out, 960 @ $.34 each | 326 | |||
|
| Prepare mail-out packets | 134 | |||
| Second mail-out (960) |
| ||||
|
| Print cover letter | 25 | |||
|
| Address envelopes | 25 | |||
|
| Postage for mail-out, 960 @ $.55 each | 528 | |||
| Postage for return envelopes, 960 @ $.55 each | 528 | ||||
|
| Sign letters, stamp envelopes | 100 | |||
|
| Prepare mail-out packets | 118 | |||
| Third mail-out (960) |
| ||||
|
| Pre-stamped postcards, 4 bunches of 250 @ $.20 each | 200 | |||
|
| Address postcards | 25 | |||
|
| Print message and sign postcards | 50 | |||
|
| Process, precode, edit 390 returned questionnaires, 10 min each | 545 | |||
| Fourth mail-out (475) |
| ||||
|
| Print cover letter | 25 | |||
|
| Address envelopes | 25 | |||
|
| Sign letters, stamp envelopes | 25 | |||
|
| Prepare mail-out packets | 168 | |||
|
| Postage for mail-out, 475 @ $.55 each | 261 | |||
|
| Postage for return envelopes, 475 @ $.55 each | 261 | |||
|
| Process, precode, edit 185 returned questionnaires, 10 min each | 250 | |||
| Total, excluding professional time | 5,025 | ||||
| Professional time (120 hrs @ $35,000 annual salary plus 20% fringe benefits) | 2,423 | ||||
| Total, including professional time | 7,418 | ||||
| B. Telephone Survey | Total Cost (dollars) | ||||
| Prepare for survey |
| ||||
| Use add-a-digit calling based on systematic, random sampling from directory | 84 | ||||
|
| Print interviewer manuals | 37 | |||
|
| Print questionnaires (940) | 84 | |||
|
| Train interviewers (12-hour training session) | 700 | |||
|
| Miscellaneous supplies | 25 | |||
| Conduct the survey |
| ||||
|
| Contact and interview respondents; edit questionnaires; 50 minutes per completed questionnaire | 2,786 | |||
|
| Telephone charges | 3,203 | |||
| Total, excluding professional time | 6,919 | ||||
| Professional time (120 hrs @ $35,000 annual salary plus 20% fringe benefits) | 2,423 | ||||
| Total, including professional time | 9,342 | ||||
| C. Face-to-Face Survey | Total Cost (dollars) | ||||
| Prepare for survey |
| ||||
|
| Purchase map for area frame | 200 | |||
|
| Print interviewer manuals | 29 | |||
|
| Print questionnaires (690) | 379 | |||
|
| Train interviewers (20-hour training session) | 1,134 | |||
|
| Miscellaneous supplies | 25 | |||
| Conduct the survey |
| ||||
|
| Locate residences; contact respondents; conduct interviews; field-edit questionnaires; 3.5 completed interviews per 8-hour day | 9,555 | |||
| Travel cost ($8.50 per completed interview; interviewers use own car) | 4,420 | ||||
| Office edit and general clerical (6 completed questionnaires per hour) | 728 | ||||
| Total, excluding professional time | 16,570 | ||||
| Professional time (160 hrs @ $35,000 annual salary plus 20% fringe benefits) | 3,231 | ||||
| Total, including professional time | 19,801 | ||||
SOURCE: Adapted from Priscilla Salant and Don A. Dillman, How to Conduct Your Own Survey, pp. 46-49. Copyright © 1994 by John Wiley & Sons, Inc. Reproduced with permission of John Wiley & Sons, Inc.
The speed with which a telephone survey can be completed also makes it preferable at times. If we want people’s reactions to a particular event, for example, or repeated measures of public opinion, which can change rapidly, then the speed of telephone surveys makes them preferable in these circumstances.
Certain areas of the country and many major cities contain substantial numbers of non—English speaking people. These people are difficult to accommodate with mailed questionnaires and personal interviews unless we know ahead of time what language a respondent speaks. We can handle non—English speaking people fairly easily, however, with telephone surveys. All we need are a few multilingual interviewers. (Spanish speakers account for the vast majority of non—English speaking people in the United States.) If an interviewer contacts a non—English speaking respondent, then he or she can simply transfer that respondent to an interviewer who is conversant in the respondent’s language. Although multilingual interviewers can be—and are—used in personal interviews, this process is far less efficient, probably involving at least one callback to arrange for an interviewer with the needed language facility. A final advantage of telephone interviews is that supervision is much easier. The problem of interviewer falsification is eliminated, because supervisors can monitor the interviews at any time. This makes it easy to ensure that specified procedures are followed and any problems that might arise are quickly discovered and corrected.
Despite these considerable advantages, telephone surveys have several limitations that may make the method unsuitable for many research purposes. First, telephone surveys must be quite short in duration. Normally, the maximum length is about 20 minutes, and most are even shorter. This is in sharp contrast to personal interviews, which can last for an hour or longer. The time limitation obviously restricts the volume of information that interviewers can obtain and the depth to which they can explore issues. Telephone surveys work best when the information desired is fairly simple and the questions are uncomplicated.
A second limitation stems from the fact that telephone communication is only voice to voice. Lack of visual contact eliminates several desirable characteristics of personal interviews. The interviewer cannot supplement responses with observational information, for example, and it is harder for an interviewer to probe effectively without seeing the respondent. Furthermore, a phone interview precludes the use of cards with response alternatives or other visual stimuli. The inability to present complex sets of response alternatives in this format can make it difficult to ask some questions that are important.
Finally, as we noted in Chapter 6, surveys based on samples drawn from listings of telephone numbers may have considerable noncoverage, because some people do not have telephones at all, others have unlisted numbers, and still others have cell phones, which may have unlisted numbers and are not linked to specific geographic locations, such as a household. In addition, some people today have both a cell phone (sometimes more than one) and a landline; this means that, even with random-digit dialing, people with multiple phones have a greater likelihood of being selected for a sample than people with only one phone (or no phone) do. Although modern telephone sampling techniques, such as random-digit dialing, eliminate some problems, sampling bias remains a potential problem when using telephone numbers as a sampling frame. Because some human service clients are heavily concentrated in the population groups that are more likely to be missed in a telephone sample, we should exercise special care when using a telephone survey. The Eye on Ethics section discusses some ethical considerations that arise when surveying people on their cell phones.
Computer-mediated communications technologies now assist survey research through computer-assisted interviewing (CAI), or using computer technology to assist in designing and conducting questionnaires and interviews. One important form this takes is computer-assisted telephone interviewing (CATI), where an interview is conducted over the telephone: In CATI, the interviewer reads questions from a computer monitor instead of a clipboard and records responses directly into the computer via the keyboard instead of a paper form. Superficially, CATI replaces the paper-and-pencil format of interviewing with a monitor-and-keyboard arrangement, but the differences are much more significant. Some of the special techniques possible with CATI include personalizing the wording of questions based on answers to previous questions and automatic branching for contingency questions. These features speed up the interview and improve accuracy. CATI software enters the data from respondents directly into a data file for analysis. CATI programs help prevent errors from entering the data during the collection phase. For example, with a question that requires numerical data, such as “How old are you?,” the program can require that only numerical characters be entered. Range checks also catch errors. Assuming one is interviewing adults, the age range might be set to 18–99 years. Any response outside that range would result in an error message or a request to recheck the entry.
Online Surveys
The emergence of the Internet has led to the growth of surveys conducted online rather than in person, through the mail, or by telephone. “Internet surveys,” or “Web surveys,” sometimes are sent as e-mail or an e-mail attachment or are made available at a Web site. Online surveys are similar to other surveys in many respects, in that the basic data still involves people’s answers to questions. The differences, however, are sufficiently important that they need to be discussed.
Eye on Ethics: Ethical Use of Cell Phones in Survey Research
New technologies create new challenges for researchers, sometimes in terms of conducting ethical research. In Chapter 6, we discussed the implications of cell phones for sampling in survey research. These new technologies also introduce some important ethical considerations to be addressed by researchers who contact survey respondents on the respondent’s cell phone (Lavrakas et al. 2007). First, people sometimes answer their cell phones when they are engaging in actions that are made more difficult or dangerous by talking on the phone, such as driving a car or operating harmful machinery. In some localities, talking on a cell phone while driving is illegal. Since the survey researcher is initiating the call, he or she incurs some ethical responsibility for possibly increasing the difficulties of the respondents. One way to handle this would be to not contact people on cell phones; however, as we saw in Chapter 6, this would have significant ramifications for the representativeness of samples. So, another option is to ask, after a brief introduction, if respondents are in a safe and relaxed environment where they can adequately respond to the questions. The downside of this strategy, of course, is that it gives the respondent a ready-made excuse to refuse to participate. But other things being equal, ethical considerations would take precedence over concerns about response rate.
Another ethical concern is that calling a cell phone may incur a cost to the recipient if the cell phone contract requires a charge for each call received. This can be handled by offering to reimburse the recipient for the charge.
A third ethical concern is that people often answer cell phones in public places, and this may impact on their ability to keep their responses private and confidential. Once again, this can be handled by asking respondents if they are in a location where they feel comfortable answering questions.
Finally, federal regulations control the use of cell phones, and researchers need to be careful not to violate them. For example, some interpretations of these regulations suggest that you are prohibited from using “mechanical dialers” to call cell phones unless the person has given prior consent to being called. Many researchers do use such devices when doing Random Digit Dialing with large samples (see Chapter 6). This problem can be avoided by manually calling the cell phone numbers, but this increases time and cost. It also may have an impact on respondent cooperativeness because some cell phone owners believe that such mass phone contacts are completely prohibited.
Online surveys have many advantages. Among the major advantages are their speed, low cost, and ability to reach respondents anywhere in the world (Fricker and Schonlau 2002; Schonlau et al. 2004). Most studies find that compared with mailed or telephone surveys, online surveys can be done much less expensively and that the responses are returned much more quickly.
Another advantage of online surveys is the versatility and flexibility offered by the technology. The questionnaire text can be supplemented with a variety of visual and auditory elements, such as color, graphics, images (static and animated), and even sound (Couper, Tourangeau, and Kenyon 2004). (This is discussed in Chapter 13 as a measurement issue.) The technology also can provide randomized ordering of questions for each respondent, error checking, and automatic skip patterns so that respondents can move easily through the interview. In addition, the data can be entered directly into a database once the respondent submits it.
The anonymity and impersonal nature of online interaction also may have advantages in research. For example, we discuss in this chapter the problem of interviewer effects—that is, how interviewer characteristics, such as race or gender, and behavior may influence people’s responses to questions. When answering questions online, there is no interviewer to produce such effects (Duffy et al. 2005). Similarly, the absence of an interviewer reduces the impact of social desirability—that is, respondents’ concerns about how their responses appear to other people. Researchers may even find computer surveys to be a more ethical approach in terms of minimizing the harm associated with revealing sensitive data, such as child maltreatment (Black and Ponirakis 2000). It also provides a good way to contact and collect data from groups that are difficult to access in other ways, possibly because they are relatively rare in the population or because of their involvement in undesirable or deviant interests or activities (Duffy et al. 2005; Koch and Emrey 2001). In fact, people seem to be more likely to admit their involvement in undesirable activities during online surveys compared with other types of surveys.
Online surveys also have their disadvantages, of course. Sampling and representativeness are especially problematic (Duffy et al. 2005; Kaplowitz, Hadlock, and Levine 2004; Schonlau et al. 2004). One problem is that not everyone has access to or actually uses the Internet. A second problem is that, even among those with Internet access, not everyone chooses to respond to requests to fill out an online survey. Given these problems, some argue that online surveys should be considered to be convenience samples rather than probability samples, with all the limitations in statistical analysis and generalizability that this implies (see Chapter 6). The population of people who use the Internet tends to be skewed toward those who are affluent, well educated, young, and male. So, unless the research has a clearly defined population, all of whose members have access to and actually use the Internet, questions about the representativeness of online respondents are difficult to resolve. Even with a clearly defined population and sampling frame, nonresponse can significantly distort results. For example, an online survey of the faculty members at a university probably would involve a population where all members have Internet access; however, it may be the younger faculty or those from particular academic disciplines who are most likely to respond. Thus, researchers need to scrutinize the issues of response rate and representativeness, just as they do with other types of surveys. For needs assessment surveys, however, and some kinds of qualitative research where probability samples are not critical, researchers may find online surveys quite useful.
Strategies are being developed to deal with these problems of sampling and representativeness. One approach uses the random selection of telephone numbers to identify a probability sample of people who are representative of a particular population. These people are then contacted and asked to participate. Those who agree are supplied with Internet equipment and an Internet service connection (or they can use their own equipment). This panel of study members can then be repeatedly contacted by e-mail and directed to a Web site to complete a survey (KnowledgeNetworks is one organization that does this: www.knowledgenetworks.com).
Another difficulty with online surveys is formatting: Different computer systems can change formatting in unpredictable ways. A survey that looks fine on the designer’s computer screen may become partially unintelligible when e-mailed to a respondent’s computer. In addition, all Internet browsers and servers may not support the design features in some Web page design software. Earlier in this chapter, we mentioned the importance of survey appearance in terms of achieving high response rates and gathering complete and valid responses. If respondents with various computers receive differently formatted surveys, this may influence their willingness to participate or their responses (and introduce error into the measurement). This is a serious concern, although technological improvements undoubtedly will reduce the seriousness of this problem in the future.
Focus Groups
Research situations sometimes arise in which the standardization found in most surveys and interviews is not appropriate and researchers need more flexibility in the way they elicit responses to questions. One area in which this is likely to be true is exploratory research. Here, researchers cannot formulate questions into precise hypotheses, and the knowledge of some phenomena is too sketchy to allow precise measurement of variables. This also is true in research on personal and subjective experiences that are unlikely to be adequately tapped by asking the same structured questions of everyone.
In such research situations, the focus group, or group depth interview, is a flexible strategy for gathering data (Krueger and Casey 2008; Morgan 1994). As the name implies, this is an interview with a whole group of people at the same time. Focus groups originally were used as a preliminary step in the research process to generate quantitative hypotheses and to develop questionnaire items, and they are still used in this way. Survey researchers, for example, sometimes use focus groups as tools for developing questionnaires and interview schedules. Now, however, researchers also use focus groups in applied research as a strategy for collecting data in their own right, especially when the researchers are seeking people’s subjective reactions and the many levels of meaning that are important to human behavior. Today, tens of millions of dollars are spent each year on focus groups in applied research, marketing research, and political campaigns. One example of this is a study of the barriers that women confront in obtaining medical care to detect and treat cervical cancer, a potentially fatal disease that is readily detected and treated if women obtain Pap smears on a regular basis and return for follow-up care when necessary. These researchers decided that a focus group “would allow free expression of thoughts and feelings about cancer and related issues” and would provide the most effective mechanism to probe women’s motivations for not seeking appropriate medical care (Dignan et al. 1990, p. 370).
A focus group usually consists of at least one moderator and up to 10 respondents, and it lasts for up to three hours. The moderator follows an interview guide that outlines the main topics of inquiry and the order in which they will be covered, and he or she may have a variety of props, such as audiovisual cues, to prompt discussion and elicit reactions. Researchers select focus group members on the basis of their usefulness in providing the data called for in the research. Researchers chose the women for the study on cervical cancer, for example, because, among other things, all had had some previous experience with cancer. Normally, focus group membership is not based on probability samples, which Chapter 6 points out as the most likely to be representative samples. This, therefore, can throw the generalizability of focus group results into question. In exploratory research, however, such generalizability is not as critically important as it is in other research. In addition, most focus group research enhances its representativeness and generalizability by collecting data from more than one focus group. The cervical cancer study, for example, involved four separate focus groups of 10 to 12 women each, and some research projects use 20 or more focus groups.
The moderator’s job in a focus group is to initiate discussion and facilitate the flow of responses. Following an outline of topics to cover, he or she asks questions, probes unclear areas, and pursues lines of inquiry that seem fruitful. A focus group, however, is not just 10 in-depth interviews. Rather, the moderator uses knowledge of group dynamics to elicit data that an interviewer might not have obtained during an in-depth interview. For example, a status structure emerges in all groups, including focus groups; some people become leaders and others followers. The moderator uses this group dynamic by encouraging the emergence of leaders and then using them to elicit responses, reactions, or information from other group members. Group members often respond to other group members differently than they respond to the researcher/moderator. People in a focus group make side comments to one another—something obviously not possible in a one-person interview—and the moderator makes note of these comments, possibly encouraging group members to elaborate. In fact, in a well-run focus group, the members may interact among themselves as much as they do with the group moderator. In a standard interview, the stimulus for response is the interviewer’s questions; in contrast, focus group interviews provide a second stimulus for people’s responses—namely, the group experience itself.
The moderator also directs the group discussion, usually from more general topics in the beginning to more specific issues toward the end (Krueger and Casey 2000). For example, in the focus group study of cervical cancer, the moderators began with questions about general life concerns and the perceived value of health, and they ended with specific questions about cancer, cancer screening, and Pap smears. The general questions provided a foundation and a context, without which the women might not have been as willing—or as able—to provide useful answers to the more specific questions. Group moderators take great care in developing these sequences of questions. The moderator also observes the characteristics of the participants in the group to ensure effective participation by all members. For example, the moderator constrains a “rambler” who talks a lot but doesn’t say much and encourages “shy ones” who tend to say little to express themselves. In short, moderating a focus group is a complex job that calls for both an understanding of group dynamics and skills in understanding and working with people.
During a focus group session, too much happens too fast to engage in any useful data analysis on the spot. The focus group produces the data, which are preserved on videotape or a tape recording for later analysis. During this analysis, the researcher makes field notes from the recordings and then prepares a report summarizing the findings and presenting conclusions and implications. Data from a focus group usually are presented in one of three forms (Krueger and Casey 2000). In the raw data format, the researcher presents all the comments that group participants made about particular issues, thus providing the complete range of opinions the group expressed. The researcher offers little interpretation other than to clarify some nonverbal interaction or nuance of meaning that could be grasped only in context. The second format for presentation is the descriptive approach, in which the researchers summarize in narrative form the kinds of opinions expressed by the group, with some quotes from group members as illustrations. This calls for more summary on the part of the researcher, but it also enables him or her to cast the results in a way that best conveys the meaning communicated during the group session. The third format is the interpretive model, which expands on the descriptive approach by providing more interpretation. The researcher can provide his or her own interpretations of the group’s mood, feelings, and reactions to the questions. This may include the moderator’s impression of the group members’ motivations and unexpressed desires. The raw data model is the quickest manner of reporting results, but the interpretive model provides the greatest depth of information from the group sessions. Of course, the interpretive approach, because it does involve interpretation, is more likely to exhibit some bias or error.
Focus groups have major advantages over more structured, single-person interviews: The focus groups are more flexible, cost less, and can provide quick results. In addition, focus groups use the interaction between people to stimulate ideas and to encourage group members to participate. In fact, when run properly, focus groups have high levels of participation and, thus, elicit reactions that interviewers might not have obtained in a one-on-one interview setting. Unfortunately, focus groups also have disadvantages: The results are less generalizable to a larger population, and the data are more difficult and subjective to analyze. Focus groups also are less likely than interviews to produce quantitative data; in fact, focus group data may more closely resemble the field notes that are produced in field research, which we will discuss in Chapter 9.
Practice and Research Interviews Compared
The interview is undoubtedly the most commonly employed technique in human service practice. Therefore, it is natural for students in the human services to wonder how research interviewing compares with practice interviewing. The fundamental difference is the purpose of the interview. Practitioners conduct interviews to help a particular client, whereas researchers conduct interviews to gain knowledge about a particular problem or population. The practitioner seeks to understand the client as an individual and, often, uses the interview to effect change; the researcher uses the data collected on individuals to describe the characteristics of and variations in a population. To the practitioner, the individual client system is central. To the researcher, the respondent is merely the unit of analysis, and the characteristics and variability of the population are of primary concern.
Information Technology in Research: Survey Design and Data Collection
An ever-expanding array of online survey tools is now available to researchers. A quick Web search with the term “online surveys” generates a substantial list of Web sites promising quick, easy survey design and delivery that any novice can use to gather data and report results. At the other end of the spectrum are sophisticated survey sites which are relied upon by universities, research centers, and major corporations for survey design, delivery, analysis, and reporting. Examples of organizations offering extensive survey tools include Qualtrics (www.qualtrics.com/), Survey Methods (www.surveymethods.com/), and QuestionPro (www.questionpro.com/).
Our experience has been primarily with Qualtrics, but many of the features described here are common to other providers as well. Modern Web-based survey organizations go beyond simply permitting a researcher to post survey questions on a Web site; they provide tools and services that cover the entire research process, including survey instrument design, sample selection, question delivery, data gathering, data analysis, and report generation and dissemination. Because they can incorporate all the media of the Internet, in addition to questions in text form, they employ audio and video presentations to elicit responses. Participants may record answers by typing words, clicking radio buttons, or manipulating a slide image among other means.
To aid researchers in survey design, a question library is available. During the design process, the researcher can select individual questions or blocks of questions with a mouse click. In addition to drawing on hundreds of standard questions, researchers can store their own questions as they develop them for use in future surveys and use a survey that they have created as a template for future surveys. Many different question formats are available. Once the survey has been developed, it can be printed for completion by hand, but completion online is generally preferred in order to take advantage of the full range of Web features.
For example, the practice of using the concept of contingency questions, or “skip-logic,” is especially applicable to Web surveys. The Web survey only displays those questions that are relevant to a respondent based upon previous answers. As respondents progress through the survey, they need not deal with irrelevant items or be depended upon to follow directions such as “If your answer to question 5 was X, then go to Section 7.” Similarly, individual answer options that are irrelevant to certain respondents can be dropped from the display, which simplifies and speeds up completion by the respondent. Response choices and blocks of questions can also be randomized to help detect and avoid bias due to response order. If the researcher wishes to imbed an experiment in the survey (such as comparing the effect of a question worded in two different ways), a simple menu choice within the program results in respondents’ randomly getting one question version or the other.
An obvious advantage of online surveys is that the data are stored directly in a database without the need for manual data entry. However, these programs not only store data, but they can generate instant statistical analyses, including graphs and charts, and enable the user to distribute the results via the Web or in printed reports. The data can also be downloaded for analysis with statistical software programs such as SPSS. Survey quality control is also facilitated because the program can provide overall survey statistics, such as drop-out rates, average response time per question, completion percentages, and start times. These are only some of the features that make Web-based surveys so appealing. More in-depth coverage of Web survey methodology can be found at the Qualtrics Web site under “Survey University.”
For those situations where respondents have access to the Internet, such as many business organization and educational settings, online services are ideal. However, the temptation to employ Web-based research because of ease of use, power, rapid results, and visual appeal can generate misleading results if a significant part of the population being studied lacks Internet access.
The difference in purpose is the basis for the differences between practice and research interviewing. Whereas we select respondents to represent a population, we accept clients because they have individual needs that the agency serves. Research interviews typically are brief (often single encounters); practice relationships are often intensive, long-term relationships. Clients (or clients’ needs) often determine the topic and focus of a practice interview, whereas the nature of the research project predetermines the content of the research interview. The ideal research interview presents each respondent with exactly the same stimulus to obtain validly comparable responses. The ideal practice interview provides the client with a unique situation that maximizes the potential to help that individual.
An emphasis on the differences between the two forms of interviewing, however, should not obscure their similarities. Both require that the interviewer make clear the general purpose of the interview. Both require keen observational skills and disciplined use of self according to the purpose of the interview. This last point is crucial to answering another question about interviewing: Do practitioners make good research interviewers? The answer depends on the nature of the particular interview task and on the interviewer’s capacity to perform that task. Interviewers who display warmth, patience, compassion, tolerance, and sincerity best serve some situations; other situations require reserved and controlled interviewers who bring an atmosphere of objective, detached sensitivity to the interview (Kadushin and Kadushin 1997). Some researchers have found that verbal reinforcement—both positive comments to complete responses and negative feedback to inadequate responses—results in obtaining more complete information from respondents (Vinokur, Oksenberg, and Cannell 1979). Although successful in terms of amount of information gained, such techniques might be foreign to the style of interviewing that a practitioner uses. Thus, for the structured, highly controlled interview, a practitioner who is used to improvising questions and demonstrating willingness to help may be a poor choice as an interviewer. In situations requiring in-depth, unstructured exploratory interviews, however, that same practitioner’s skills might be ideal. Again, the purpose of the interview and the nature of the task determine the compatibility of human service skills with the research interview.
Review and Critical Thinking
Main Points
Surveys are of two general types: (1) questionnaires completed directly by respondents, and (2) interviews with the questions read and the responses recorded by an interviewer.
Closed-ended questions provide a fixed set of response alternatives from which respondents choose.
Open-ended questions provide no response alternatives, leaving respondents complete freedom of expression.
Once developed, survey instruments should be pretested for clearly understood and unbiased questions; after changes are made in the instrument, it should be pretested again.
Questionnaires must provide clear directions, both to indicate what respondents should do and to guide them through the questionnaire.
Researchers should order questions so that early questions maximize the response rate but do not affect the responses to later questions.
Obtaining a high response rate (the percentage of surveys actually completed) is very important for representativeness in survey research.
The cover letter, use of payments and follow-up letters, and length and appearance of the questionnaire are all central in efforts to maximize the response rate with the mailed questionnaire.
Interviews are classified by their degree of structure as unstandardized, nonschedule-standardized, or schedule-standardized.
Probes elicit clearer and more complete responses during interviews.
Telephone surveys offer significant savings in terms of time and cost compared with interviews or mailed questionnaires and, in many cases, are a suitable alternative.
Online surveys are fast and inexpensive compared to other surveys and permit flexible formatting and design, but they raise serious questions regarding sampling and representativeness.
Focus groups rely on group dynamics to generate data that would not be discovered using a standard questionnaire or interview format.
Web sites are now widely available that will conduct surveys from beginning to end—from designing the survey instrument to the analysis of the data and the preparation of a report.
Important Terms for Review
closed-ended questions
computer-assisted interviewing
computer-assisted telephone interviewing
contingency question
cover letter
filter question
focus group
group depth interview
interview
interview schedule
interviewer falsification
matrix question
open-ended questions
probes
questionnaire
response rate
survey
survey research
Critical Thinking
The research techniques discussed in this chapter involve observations of what people say about the thoughts, feelings, or behaviors of themselves or others. This kind of research technique has advantages, but it also has drawbacks. Practitioners and policymakers, as well as people in their everyday lives, need to be cautious when confronted with information or conclusions based on similar data. Consider the following:
Are the topic and the conclusions best addressed by what people say about their thoughts or behavior (a survey) or by direct observation? Is it legitimate to conclude something about people’s behavior from what they have said?
What questions were asked and how were they asked? Do they contain any of the flaws that could produce bias or misinterpretation? Is there anything in their design (wording, context, etc.) that might lead to misunderstanding, misinterpretation, or bias in the information that results?
What about reactivity? Could the manner in which the information was gathered have influenced what people said?
What about sampling? Could the manner in which the information was gathered, such as by telephone, by cell phone, or online, have influenced who the observations were made on?
Exploring the Internet
Most major survey research centers maintain Web sites, and some of them are extremely useful. At many sites, you can find a basic overview of survey research, a discussion of ethics in surveys, and information on how to plan a survey. Some even provide the opportunity to examine questions used in actual surveys. It also is possible to download and read entire questionnaires and survey instruments. By reviewing these surveys, you can explore how the researchers structured the instrument and ordered the questions, and you will see skip patterns and other features that enhance the research instrument’s quality. Not only will you become more familiar with major survey projects around the world, you can learn a great deal about how to design good survey questions.
Here is a list of some worthwhile sites:
The Odum Institute for Research in Social Science (www.irss.unc.edu/odum/jsp/home.jsp)
The General Social Survey (www.norc.org/GSS+website/)
Courses in Applied Social Surveys (in England) (www.s3ri.soton.ac.uk/cass)
American Association for Public Opinion Research (www.aapor.org; the “Best Practices” link is especially informative on planning and conducting surveys)
Survey Research Methods Section of the American Statistical Association (www.amstat.org/sections/SRMS)
Use the search engine on the Web browser available to you to look for other survey research centers, such as these:
UK Data Archive (http://www.data-archive.ac.uk/).
Statistics Canada (www.statcan.gc.ca).
National Center for Health Statistics (www.cdc.gov/nchs/surveys.htm).
For Further Reading
Dillman, Don A., J. D. Smyth, and L. M. Christian. Internet, Mail, and Mixed-Mode Surveys: The Tailored Design Method, 3rd ed. New York: Wiley, 2009. This is an excellent introduction to survey research, and it also provides the most up-to-date overview of how to conduct surveys through the mail and on the Internet.
Gorden, Raymond. Basic Interviewing Skills. Itasca, Ill.: Peacock, 1992. This useful how-to book on interviewing covers everything from developing questions to motivating good responses to evaluating respondents’ nonverbal behavior.
Gubrium, Jaber F., and James A. Holstein. Handbook of Interview Research: Context and Method. Thousand Oaks, Calif.: Sage, 2001. This complete handbook covers many forms of interviewing, including survey, qualitative, in-depth, and therapy. The book addresses technical issues, distinctive respondents, and analytic strategies.
Kadushin, Alfred, and Goldie Kadushin. The Social Work Interview: A Guide for Human Service Professionals, 4th ed. New York: Columbia University Press, This is the standard text for social work interviewing. It covers all aspects of the helping interview, and it presents a solid comparison for the survey interview.
Krueger, Richard A., and Mary Anne Casey. Focus Groups: A Practical Guide for Applied Research, 4th ed. Thousand Oaks, Calif.: Sage, 2008. This book is the standard for learning how to conduct a focus group. The third edition compares market research, academic, nonprofit, and participatory approaches to focus group research, and it describes how to plan focus group studies and do the analysis, including step-by-step procedures.
Salant, Priscilla, and Don Dillman. Conducting Surveys: A Step-by-Step Guide to Getting the Information You Need. New York: Wiley, 1994. As the title states, this is a very useful guide to all the steps in conducting sound survey research.
Schuman, Howard, and Stanley Presser. Questions and Answers in Attitude Surveys: Experiments on Question Form, Wording, and Content. Thousand Oaks, Calif.: Sage, 1996. This is a comprehensive handbook on the rules, problems, and pitfalls of designing survey questions. It goes far beyond what this chapter is able to cover on this important topic.
Sue, Valerie M., and Lois A. Ritter. Conducting Online Surveys. Los Angeles: Sage, 2007. This volume is a comprehensive guide to the creation, implementation, and analysis of e-mail and Web-based surveys. The authors specifically address issues unique to online survey research such as selecting software, designing Web-based questionnaires, and sampling from online populations.
Exercises for Class Discussion
Your state’s Department of Health and Human Services has recently released a controversial study that concludes that the state can provide better-quality foster care for less cost than private agencies can provide under a purchase-of-services contract. The private agencies are outraged and point out some serious flaws in the study. For example, the state study was made by people who might lose their jobs if the state contracts out for these services. Furthermore, the study compared a state program in an urban area to a rural, private agency program. To resolve these concerns, the independent research firm where you are employed has been asked to conduct a survey that will generate results that are representative of the entire state.
The following exercises explore some of the tasks and decisions that you face in undertaking such a survey:
| 7.1. | Would you use mailed questionnaires, telephone surveys, or personal interviews with: (a) foster parents, (b) adolescents in care, (c) line workers? Defend your choices. What additional information would help you make these decisions? |
| 7.2. | If your organization decides to send a mailed questionnaire to foster parents, what could you suggest to improve the response rate? |
| 7.3. | One of the topics to cover with foster parents is their satisfaction with the services that the foster care worker provides. Write a closed-ended question and an open-ended question to deal with this topic. In your opinion, which type of question would be best? |
| 7.4. | For interviewing the foster children, would you use a nonstandardized, a nonschedule-standardized, or a schedule-standardized format? Why? |
| 7.5. | You have the task of selecting the interviewers to conduct face-to-face interviews with the adolescents, and you have the following options: Department of Health and Human Services workers; interviewers from a political polling organization, mostly middle-aged women; or teenagers between the ages of 16 and 19 who are eligible for a state-sponsored, summer jobs program. Which group would you pick, and why? What would be the advantages and disadvantages associated with each of these groups? |
| 7.6. | Approximately 30 percent of the young people in foster care are African Americans, and another 15 percent are Hispanic. What differences will the racial composition of this population make in terms of the way you suggest doing the study? |
| 7.7. | To experience the importance of ordering questions in survey research, role play a simulated interview on conflict tactics. Conduct one simulation using the CT scale discussed on pages 367-368. Then, conduct a second simulated interview using the scale in reverse order. Discuss how the participants felt about responding to the items concerning violent behavior. |


