Attached is the exam. Thanks.
MBA624-MSF624, Exam 2, Winter 2017
MBA624-MSF624 (Winter 2017) Exam 2
Each question is worth 2.0 points, for a total of 100 points.
Use CAPITAL letters to fill table
| Q | Answer | Q | Answer | Q | Answer | Q | Answer | Q | Answer |
| 1 | 11 | 21 | 31 | 41 | |||||
| 2 | 12 | 22 | 32 | 42 | |||||
| 3 | 13 | 23 | 33 | 43 | |||||
| 4 | 14 | 24 | 34 | 44 | |||||
| 5 | 15 | 25 | 35 | 45 | |||||
| 6 | 16 | 26 | 36 | 46 | |||||
| 7 | 17 | 27 | 37 | 47 | |||||
| 8 | 18 | 28 | 38 | 48 | |||||
| 9 | 19 | 29 | 39 | 49 | |||||
| 10 | 20 | 30 | 40 | 50 |
The test link will become visible in Assignments course area at 12:00 a.m. CST on Thursday, March 1, 2018.
Due date is: 11:59 p.m. CST on Saturday, March 3, 2018. The test link will disappear at that time. So, you have 3 days (72 hours, all of Thursday, Friday, and Saturday) to work on the exam.
Exam instructions will include a MS Word file containing the questions and an Excel data file that you must use for some of the questions.
Once you are done solving and completing the exam, you must come back to the exam before the due date and click BEGIN to enter the test and enter your answers for each question, and then submit.
In case of the rare event of technical difficulty, I have given you two attempts to submit. However, because this is an exam (not HW), after submission you will NOT be told which questions are wrong.
If for any reason you must submit twice, be sure to enter all answers again because your second submission will be graded.
The exam includes 50 questions, each worth 2 points, for a total of 100 points.
This is a take-home exam. You may use your book, notes, calculator, Excel, and other resources such as videos and handouts that are provided to you in the course.
Due to rounding, an answer you compute may not exactly equal any of the options provided. In all such cases, choose the option which is closest to your own answer.
You must strictly observe the Honor Code. Do not give help to anyone, or receive help from anyone in completing this exam. Your answers must be original and your own. You must not discuss or share this exam, problems, solutions, or any part of it with other individuals.
Good Luck
Use the data on tab “Car Sales Data” in the excel file to answer questions 1-8. This data is a sample of the dealerships owned by Turbo Motors corporation.
The variable “Business Bureau Rating” is?
Nominal
Ordinal
Interval
Ratio
The variable “Total Profit” is?
Qualitative and Interval
Quantitative and Ordinal
Quantitative and Ratio
Qualitative and Ratio
For the variable “Number of Sales People” if a frequency distribution is built with a cell width of 4 and the cells being 5-8, 9-12, 13-16, 17-20 what is the cumulative relative frequency for the 13-16 cell?
40
12
0.67
0.20
What is the mode for the variable “New Car Brand”?
Honda
17
Toyota
Mode doesn’t exist for a qualitative variable
What is the average for the variable “Total Profit”?
$10,412.35
$30,778.33
$71,994.41
$40,721.08
What summary of “Used Cars Sold Each Week” is correct (use excel to calculate the quartiles)?
Min: 2, Q1: 3, Q2: 5, Q3: 7, Max: 8
Min: 3, Q1: 3, Q2: 5, Q3: 7, Max: 10
Min: 2, Q1: 4, Q2: 6, Q3: 7, Max: 8
Min: 2, Q1: 3, Q2: 4, Q3: 6, Max: 8
If a car dealership has Toyota as it’s New Car Brand, what is the probability it has a AA+ Business Bureau Rating?
0.250
0.400
0.375
0.655
What is the probability a dealership has Ford as it’s New Car Brand and has a AAA Business Bureau Rating?
0.65
0.20
0.33
0.05
How many outcomes are possible in an experiment in which a coin is flipped 4 times and a six side di is rolled 3 times?
2
12
3456
1723
There is a 20% chance that a customer entering one of the dealerships will purchase a new car. What is the probability that 5 of the next 15 customers will purchase a new car?
0.1032
0.9389
0.2648
0.1645
There is a 20% chance that a customer entering one of the dealerships will purchase a new car. What is the probability at least 4 of the next 15 customers will purchase a new car?
0.2561
0.3518
0.8358
0.1642
The time to complete an oil change at the dealerships is normally distributed with a mean of 16.5 minutes and a standard deviation of 2.5 minutes. What is the probability an oil change will take exactly 16.5 minutes?
0.3625
0.6431
0.5000
0.0000
The time to complete an oil change at the dealerships is normally distributed with a mean of 16.5 minutes and a standard deviation of 2.5 minutes. What is the probability an oil change will take more than 18 minutes?
0.7257
0.2743
0.1333
0.6127
The time to complete an oil change at the dealerships is normally distributed with a mean of 16.5 minutes and a standard deviation of 2.5 minutes. What is the probability an oil change will take between 14.2 and 17 minutes?
1.0000
0.6824
0.4005
0.2345
Given the data below describing orders not correctly filled at Sweet Sallie’s BBQ answer questions 15 and 16 (using +-3 st dev control chart – as done in the text)
| Day | # Orders | Orders not correct |
| 40 | 10 | |
| 40 | 11 | |
| 40 | ||
| 40 | ||
| 40 | 12 | |
| 40 | ||
| 40 | 14 |
If tasked to develop a (P bar) control chart what would be the centerline value?
40
.0369
.2393
.4416
Looking at the control chart does there appear to be special cause variation?
Absolutely
Several points exceed the Upper Control Limit
No, the process appears in control
Not clear from data available
Given the data below of a sample of 5 separate pages published by the Charismatic Magazine Company answer questions 17 &18 (c chart - using +-3 st dev control chart – as done in the text).
| Page | # of Typos on the page |
What is the LCL for the C chart?
0 (it does not exist)
3.4
8.932
-2.132
What is the UCL?
0 (it does not exist)
3.4
8.932
-2.132
Glow worm is a company that produces light bulbs and other electrical products. One light bulb is supposed to have an average life of about 1000 hours before it burns out. Periodically, the company will test 5 of these and measure the average time before the bulbs burn out. Use the following table of 10 such samples for questions 19-22:
| Sample | 10 | |||||||||
| Mean | 1000 | 979 | 1065 | 963 | 972 | 1052 | 988 | 999 | 1087 | 1016 |
| Range | 70 | 149 | 138 | 69 | 61 | 58 | 83 | 57 | 103 | 102 |
What are the lower and upper control limits for the R chart?
0 and 131.1
0 and 161.9
0 and 188.1
0 and 89
What is center line for the R chart?
131.1
161.9
188.1
89
What are the upper and lower control limits for the
 chart?
808.2 and 1,215.4
960.7 and 1,063.5
0 and 1,011.8
0 and 203.6
Is the process in control?
The range is in control so the entire process is in control
The mean is in control
Special causes of variation may be present for the process range.
Special causes of variation may be present for the process mean
If the sample size is increased 5 to 10 for computing R and X chart values?
D3 increases
D4 decreases
A2 decreases
All of the above
The following data set shows the results of a survey conducted to see if there is a relationship between the number of hours studying and students’ test grades. Use this data to develop a regression that will predict student’s grade based on number of study hours. Use this data to answer questions 24 - 28
| Study hrs/wk | Test Grade |
| 67 | |
| 15 | 94 |
| 17 | 93 |
| 16 | 92 |
| 14 | 91 |
| 65 | |
| 12 | 85 |
| 11 | 95 |
| 13 | 84 |
| 20 | 99 |
| 65 |
What is the correlation coefficient for this model?
0.94
0.97
-0.88
0.88
Which of these statements below is true?
88% of the variability of the test grades is explained by the number of hours studied
94% of the variability of the hours studied is explained by the test grade
88% of the variability of both variables is explained by the regression
Both B and C are true
What is the sum of squares error for the model?
3.031
33.35
204.22
18.565
Based on this regression model, if a student spends an average of 11 hours per week studying, what will his/her expected test grade be (round to the nearest integer)?
95
83
90
Not enough information to answer this question
What is the dependent variable (study hours per week or test grade)?
Study hours per week is the dependent variable
Test grade is the dependent variable
Both variables are dependent on each other
Neither of the variables are dependent
Use the following excel regression output to answer questions 29 – 32:
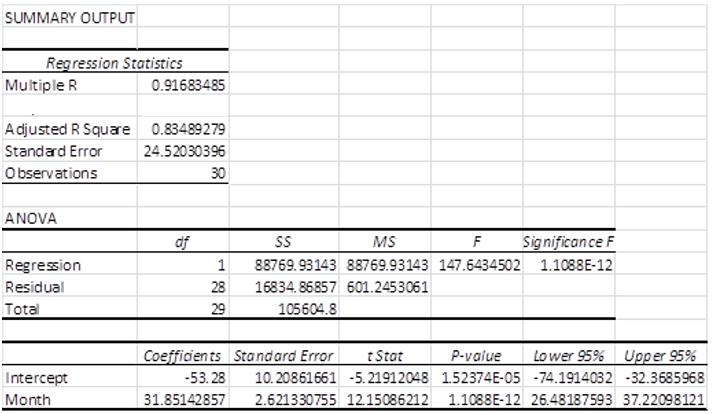
What is the coefficient of determination for the model?
0.917
31.85
-53.28
0.841
What is the correlation coefficient of the model?
0.917
31.85
-53.28
0.841
What is the sum of squares regression (round to the nearest integer)?
83
601
16835
88770
What is the standard error of the regression?
10.21
24.52
2.62
12.83
The below table represents the car sales at a local used car dealer. Use the data on questions 33 to 35.
| Month | Demand |
| January | 120 |
| February | 110 |
| March | 130 |
| April | 120 |
| May | 145 |
| June | 125 |
Using a three month moving average, what is the forecast for July?
120
130
125
135
Using a 2 month weighted moving average where the latest month has a weight of 0.7, what is the forecast for July?
120.5
87.5
135
131
The Forecast for January was 130. Using an alpha of 0.4, what is the forecast for July using exponential smoothing?
128.8
132.7
126.4
130.2
The table below shows the demand and the forecasted amounts for an item at a local business. Use this table to answer questions 36 to 38.
| Month | Demand | Forecast |
| January | 700 | 800 |
| February | 675 | 700 |
| March | 700 | 750 |
| April | 800 | 820 |
| May | 750 | 675 |
| June | 675 | 650 |
What is the mean absolute deviation for the forecast?
49.2
45.3
34.2
39.7
What is the mean squared error for the forecast?
2976
1727
3296
3872
What is the MAPD for the forecast?
6.9%
4.8%
9.7%
7.9%
The table below illustrates the quarterly sales of swimsuits at a local retailer. Using the method shown in the text, calculate the forecast for quarter 2 in year 5.
| Year | Quarter 1 | Quarter 2 | Quarter 3 | Quarter 4 |
| 25 | 75 | 125 | 75 | |
| 40 | 100 | 150 | 60 | |
| 50 | 120 | 160 | 70 | |
| 85 | 140 | 175 | 100 |
160
154
142
169
The data in the table below shows the number of attendees at Husker Water Park. Develop a linear regression to for the number of attendees based on the forecast temperature. What would be the forecasted attendance with a forecasted temperature of 88 degrees?
| Forecast Temperature | Attendance |
| 60 | 10 |
| 65 | 15 |
| 70 | 25 |
| 80 | 50 |
| 90 | 75 |
| 95 | 100 |
70
65
80
75
The table below illustrates the MAD, MAPD, and the MSE for 4 different forecasts. Which forecast method would be best to use moving forward?
| Forecast Method | MAD | MAPD | MSE |
| Moving Average | 27.2 | 9.60% | 710 |
| Weighted Moving Average | 16.4 | 5.40% | 354 |
| Exponential Smoothing | 30.7 | 10.20% | 878 |
| Regression | 24.6 | 7.80% | 576 |
Moving Average
Weighted Moving Average
Exponential Smoothing
Regression
Using the following data to answer questions 42-44
| Activity | Optimistic | Most likely | Pessimistic |
| 10 | |||
| 11 | 12 | ||
| 10 | |||
| 11 | 14 | 16 | |
| 10 | 16 | ||
What is the mean expected completion time for activity D?
11.83
6.67
12.09
10.56
There are two activities (D and E) in the critical path, what is the variance of the critical path?
2.333
2.47
2.028
2.456
What is the standard deviation of activity G?
0.833
0.756
0.652
0.231
Use the following table to answer question 45-48.
| Activity | Predecessor | Completion time |
|
| ||
|
| ||
| D, E | ||
| F, G |
What is the project completion time?
22
20
15
17
Which activities are on the critical path?
B, D, E, H
B, D, G, H
A, C, E, G, H
A, C, F, H
What is the latest finish time for activity D?
12
10
9
Which activity has the most slack?
C
F
You have the following results for a given period:
Expected completion time of the given project = 48
Variance of project completion time = 6.25
What is the probability of completing the project over 46 days?
0.957
0.886
0.7881
0.853
If a project is to be crashed at the minimum possible additional cost, then the first activity to be crashed must be:
A. On the critical path
B. the one with the shortest activity time.
C. the one with the longest activity time.
D. the one with the lowest cost.
Record your answers using CAPITAL letters in the table on first page.
Enter your answers into the exam answer sheet in Black Board
16


