MPA625 M6D1: Life Cycle Costs & Sensitivity Analysis I need it in question/ answer formatEach part has to have at least 500 words. Part 1In this module, you have learned about the importance of Life C
MPA625 M6D1: Life Cycle Costs & Sensitivity Analysis
I need it in question/ answer format
Each part has to have at least 500 words.
Part 1
In this module, you have learned about the importance of Life Cycle Cost and Sensitivity Analyses in the decision-making process. In this discussion, you will identify and define the variables in the Life Cycle Cost (LCC) & Sensitivity Analysis of a given scenario.
Respond to the following:
Excluding energy and environmental conservation efforts, identify a scenario in your local or state government that would benefit from the LCC & Sensitivity Analysis.
Identify the costs and other variables that may impact these analyses. Calculate the LCCs using Excel.
Determine whether the purchase in your scenario is justifiable. Use your LCC & Sensitivity Analysis to support your position.
M6D2: Applying Trend Analyses Part 2
Throughout the course, you have learned that the method of analysis is determined by whether data is qualitative or quantitative. In this activity, you will discuss how this concept applies to selecting the appropriate forecast analysis technique.
Respond to the following:
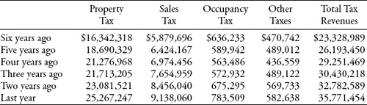
Using the data in Table 30-1 (Table Below), use a scatterplot to create a simple regression trend analysis. Explain what the data shows.
Based on the regression analysis, propose an expert opinion concerning the future of Misty Glen Tax Revenues. What do you think will happen?
Table 30-1 Misty Glen Tax Revenues: Most Recent Six Years
Notes:
Required
Ammons, D. N. (2009). Tools for decision making: A practical guide for local government. Washington, DC: CQ Press.
Chapter 18: Life-Cycle Costing
Chapter 19: Sensitivity Analysis
Chapter 30: Forecasting Via Trend Analysis
United States General Services Administration. (2015). 1.8 life cycle costing (Links to an external site.)Links to an external site.. Retrieved from http://www.gsa.gov/portal/content/101197
Module notes
Module Notes: Life Cycle Costs & Sensitivity Analysis
Over the past few years, improving energy efficiency as well as reducing pollution and emissions has been at the forefront of government concerns. The Office of Energy Efficiency was established under the United States Department of Energy and is charged with researching and developing more energy efficient methods of energy production as well as reducing the energy use in homes. Consequently, states were given Energy Efficiency Mandates, which required each state to work with the local utility companies to reduce energy consumption.
Let us look at the various analyses and considerations in this scenario.
Select each tab to learn more.
Dealing With Utility Companies
There are a number of ways to achieve energy reduction, but a significant amount of money must be invested to decrease usage to the extent required. Ideally, these investments would be made by the utility companies, but state governments quickly learned that utility companies were not eager to reduce their profit margins by reducing usage or to make the capital investments required to meet these new Energy Mandates. The first response of the utility companies was to conduct a Life Cycle Cost Analysis (LCCA) to indicate the total cost of owning the technology required to meet these mandates. In addition, the companies wanted to prove to state regulators that it was not economically feasible and that they could not afford to make these investments to improve efficiency. Furthermore, they argued that energy efficiency was highly sensitive to a number of factors, including energy programs offered by the state. Finally, they agreed to make the investments if regulators agreed to permit the companies to recover some of the costs through ‘riders’ or surcharges to utility customers’ bills.
Life Cycle Cost Analyses of Utility Companies
At this point, state regulators had to closely examine these Life Cycle Cost Analyses that the utility companies provided. They also had to ensure that the costs presented were practical and accurate. Regulators took a close look at each item included in a Life Cycle Cost analysis:
Total cost of owning an item = acquisition + energy + maintenance - salvage value
To understand the complexity of this issue, remember that each state is demographically and geographically different. There is a lot of variability among the factors to be considered. In some areas, the answer to energy reduction is easy. For example, Indiana has a vast area of windmill farms used to generate energy. Indiana’s geography makes the state an excellent candidate for windmills. In the south, solar panels are an excellent option. Even some areas in Ohio can benefit greatly from southward facing solar panels. In contrast, some states have a huge manufacturing industry that uses a significant amount of energy and produces several pollutants. It is also common for poverty-stricken areas to have higher energy consumption than middle to upper class areas.
Consequently, each state has to work with the local utility company to determine what can work, where it can work, and how to purchase it at the lowest total cost of owning the item. Therefore, in addition to conducting the LCCA, a sensitivity analysis is also conducted. Essentially, each of the elements above is factored into the LCCA to determine the impact of each on the total cost of owning the item.
Example: Installation of Solar Panels in Houses
Let’s assume that regulators in Ohio have decided that solar panels are the best option to reduce energy consumption across the state. They decide to encourage homeowners and businesses to purchase solar panels. The average cost for a homeowner to install a solar panel is approximately $15,000.00, depending on how much power they want to generate from the solar panel. Some homeowners opt to choose smaller solar panels and supplement their electric usage using the panel rather than getting all of their power from the electric grid. However, some homeowners choose to remove themselves from the power grid altogether and make a substantially larger investment in the solar panels. In these cases, they are able to generate sufficient power to sell back to the utility company, thereby recovering some of the costs associated with owning the solar panel.
Which factors impact their decision to purchase the solar panel? A sensitivity analysis on this issue would assess the following:
01: The geographic location and position of the home: If the roof is not southward facing, the solar panel will be considerably less effective.
02: The accuracy of the information provided by the manufacturer: Whether or not the solar panel will perform as expected is never an absolute guarantee.
03: The weather: Ohio has four very distinct seasons and there will be extended periods of time when the sun is not out or is not out long enough to support the solar panel.
Conclusions Drawn from the Example
Remember, homeowners must consider these factors. Imagine the multitude of factors a manufacturing plant must consider. There are too many to list here. Suffice it to say, the number is so great, it was quickly determined that solar panels were not the answer to reducing energy usage in Ohio. The LCCA and the Sensitivity Analysis determined that over time, the solar panels would not significantly reduce energy consumption and, therefore, solar panels would be a bad investment for most Ohioans. The costs of owning the technology would outweigh the benefits over the life of the solar panel.
Another important factor to consider is that regulators evaluated the potential benefits of solar panels over time. Recall what you have learned about averages, outliers, and moving averages. If regulators looked at the potential of reducing energy using solar panels over a single spring or summer in Ohio, they would have a poor representation of how solar panels would actually perform during other months. The LCCA would be highly sensitive to these months because the solar panels would perform very differently than they would for the remainder of the year. In other words, these months would act as outliers. To make the best decision, they must also consider the analysis over time. When discussing averages, this is referred to as moving the average to reduce the impact of the outlier. In this context, it is known as forecasting.
Forecasting Using Trend Analysis
Forecasting involves predicting future values of an item or object over time based on current trends. As with the solar panel example, administrators might use forecasting to determine how much energy reduction could be anticipated. There are three primary types of forecasting.
Expert
Expert Judgment is used when administrators have the benefit of having an expert available to speak on the likely outcomes. This method is qualitative and subject to human error and bias. However, an expert could likely accurately predict the potential effectiveness of solar panels in the northern states.
Determine
The Deterministic Technique is used when you need to anticipate the behavior of a key variable. For example, in the example you studied in the previous screen, a key variable might be the average number of days of sunshine in a year.
Trend
Trend Analysis or time series forecasts are most commonly used when the variables are not volatile. For example, revenue from residential energy consumers is likely to change gradually over time, rather than changing significantly from year to year, even with the energy efficiency mandates. The different types of trend analysis include:
◦Time Series
◦Elementary
◦Trend Analysis Using Regression
◦Regression with Differencing
◦Exponential Smoothing
◦Econometric Techniques
Choosing Appropriate Forecasting Techniques
Choosing the appropriate forecasting technique is similar to choosing a statistical tool. The selection depends on many factors relevant to the scenario, the variables, and the data. Quantitative statistical methods are often more objective but are not always easy to execute and are not more or less reliable than less sophisticated options. Qualitative options involve less data collection and can quickly be adjusted to accommodate environmental changes. However, as with other statistical analyses, it is often best to separate the elements of the forecast and use different techniques for each element. This is similar to using mixed method data analysis.
Although regulators are likely to use forecasting in a number of ways, the most common use is for the design and implementation of the budget. Administrators design the budget based on current trends within the existing budget. Administrators are able to draw conclusions regarding how much revenue can be anticipated from personal income tax based on current unemployment rates. They are able to determine the funding that may be needed for programs such as Medicaid based on the number of people receiving TANF or SNAP benefits. This information, in turn, is used to make decisions about public spending. Undoubtedly, policy makers use budget forecasts to shape public perception about political choices, ranging from electing public officials to future taxation rates.


