I am in need for M8A1 portofoio to be adjusted (The paper is on Diversity in the workplace) with the corrections that are mentioned in the prvious attachments. (M2A1, M4A1, M6A1). Also I need for M8A1
Running head: EQUITY 0
Research Paper 3: Executing Analysis
MPA625 - M4A1
MPA625 - M6A1 - Research Paper 3: Executing Analysis
The United States of America, in an effort to provide a demonstration of equality in its own employment, has achieved a measure of demographic equality. Yet despite its mandate to fulfill equality in hiring practices, it is still difficult to determine if the United States has demonstrated true equality in its hiring practices. By examining the Office of Personnel Management (OPM) Employment by Gender and Race/National Origin data set from 2006-2017 as well as a comparison with demographic from the United States Census, the hypothesis that the United States Government has improved in its efforts to employ equitably is supported; however, in striving to demonstrate an demographic alignment in hiring practices with the demographics of the nation, the United States Government has not achieved equitable hiring patterns, due to several extraneous variables that may or may not be influencing the hiring patterns inequitably. The issue is very complex, because to assert that the United States Government is actually practicing equitable hiring patterns, the hiring pool would have to be reflective of the demographics of the United States, and this is not possible from the two data sets that have been used for this report. In other words, it is possible that a larger population of one racial group may be seeking employment with the Federal Government than other racial groups. It is also possible that there is equitable pursuit of jobs with the Federal Government for its jobs; however, it is not possible to evaluate this variable with precision, complicating any results that may emerge from an examination of the two data sets used in this study.
The 2000 United States Census shows that over 70% of the people in the nation are classified as White. Black people comprise near 12%, as did Hispanic people. If the United States Government was practicing equitable hiring patterns, it stands to reason that the hiring statistics should be similar to the general population. In 2006, almost 20% of the workers in the Federal Government were Black, well above the general population. White people were at almost 70%, less than the general population. Hispanics were not hired by the Federal Government with the same percentage, at about half of the general population (See Figure 1).

Figure 1: Comparison of Census (2000) and Employment (2006) Percentages.
The differences in hiring can be explained to be associated with the amount of people who pursued the jobs. From this snapshot, it is difficult to tell if the United States was practicing equality in hiring diversity. Yet by looking at a comparison from ten years later, the influence of the quest for diversity becomes clearer.
By 2016, the way that the Federal Government of the United States of America was hiring people indicated that a possible attempt at increasing the hiring of Hispanic people was taking place. Interestingly, fewer of these people reported to the Census; however, this may not be indicative of the actual population of Hispanic people as it is possible that many people who were Hispanic did not report themselves as Hispanic for many reasons, including fear of reprisal (Taylor, Lopez, Martínez, & Velasco, 2012). Despite the slight decrease in both Hispanic and White people in the United States according to the 2010 Census, by 2016 a decided increase in Federal employees who were Hispanic was registered (See Figure 2). This would support the hypothesis to a certain extent, that the Federal Government had made a concerted effort to recognize the diversity in the general population regarding Hispanic people, that had not been recognized in hiring patterns of a decade before. Black people stayed about the same, and White people dropped slightly regarding their employment by the Federal Government.

Figure 2: Comparison of Census (2010) and Employment (2016) Percentages.
The hypothesis that the United States should practice equality in hiring as evidenced by an alignment of population with those who are hired by the Federal Government is not supported; however, what is supported is that the Federal Government is making an effort to address inequalities by establishing hiring patterns as evidenced by the data from 2016.
Trends
While the hypothesis that the Federal Government has achieved racial equality as reflected in its own hiring patterns has not been proven, it is very clear that efforts have been made to increase racial equality as evidenced by historical data as well as by looking at the trends in hiring in 2016 and 2017 (Figure 3).
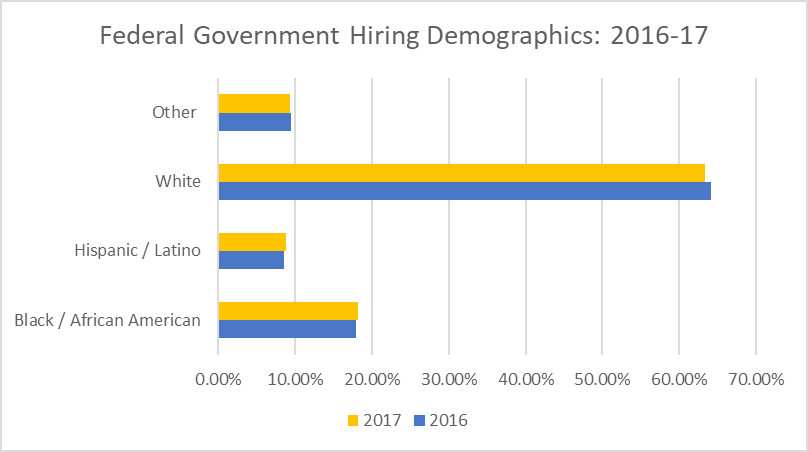
Figure 3: Federal Employment (2016 and 2017) Percentages.
As the White population in the United States continues to dip slightly, the percentage of those people who are employed by the Federal Government has also dipped. There are still more White people than are employed by the Federal Government, but these could be due to many factors, including the reality that the majority of Federal Government jobs are in major metropolitan areas, including Washington, D.C., in which the demographics of White people are decidedly less than the rest of the nation. In the District, the demographics according to the 2010 Census are that 49% Black, 43.6% White, and 8.3% Hispanic population the region. This would show that a large disparity was in place in favor of White people; however, it is worth noting that people from the outlying areas, including Northern Virginia and Southeastern Maryland provide commuter populations for Federal jobs in Washington D.C. The trend is that the Federal Government has recognized that there is a disproportionate total of Hispanics who are hired by the agency, and that the agency has made an effort to remedy this by practicing more racially diverse hiring patterns.
Conclusion
The variables in this analysis are complicated by several forces, with the actual population of people who apply for jobs representing the largest threat. In order to test the hypothesis of the Federal Government actually practicing equitable hiring patterns would require a data base that includes the demographics of the people who applied for positions, as well as the Census and Federal Government hiring patterns. If these could be acquired, then it would be possible to validate or invalidate the hypothesis. Yet the hypothesis of whether the Federal Government of the United States is actually striving for more equitable hiring patterns that align with the racial demographics of the nation is supported.
References
Ammons, D. N. (2009). Tools for decision making: A practical guide for local government. Washington, DC: CQ Press.
Taylor, P., Lopez, M. H., Martínez, J. H., & Velasco, G. (2012). When labels don’t fit: Hispanics and their views of identity. Washington, DC: Pew Hispanic Center.
U.S. Office of Personnel Management Office of Policy Planning & Analysis, Data Analysis Group. (2018). Executive Branch Employment by Gender and Race/National Origin September 2006 – September 2017. Retrieved from: https://www.opm.gov/policy-data-oversight/data-analysis-documentation/federal-employment-reports/reports-publications/executive-branch-employment-by-gender-and-racenational-origin/
United States Census. (2010). Demographic population.
Professor notes:
There is no statistical analysis proposed in Paper 2 and no analysis conducted here. There is no data set, as you state “In order to test the hypothesis of the Federal Government actually practicing equitable hiring patterns would require a data base that includes the demographics of the people who applied for positions”. This was an assignment requirement identified in Paper 1. Without a data set, you cannot execute #3. There are no percent change discussions of the variables over the years, as the second variable, I’m assuming is the federal government’s good faith efforts to hire minorities, is never clarified or quantified. You are merely counting how many employees exist by race without accounting for any number of variables that might cause those numbers to occur. Therefore, it is impossible to execute items 5 & 6. Only 1 of 4 references is both complete and cited.
Please review the feedback from the last paper. These items were not corrected in this paper:
There are no Central Tendencies calculated and presented in APA formatted chart. You have not identified independent and dependent variables and therefore, you cannot identify a potential statistical analysis. Finally, I am unsure what variables are shown on your scatterplot.
I think what you want to evaluate is whether the federal employee population represents the actual population by demographic. There is no statistical analysis needed to determine this. You would only need to identify the percentage of ready to work individuals in each demographic and location by the total number of each of those demographics in each location. I can assure you, this will be a simple and easy analysis – I’ve done it countless times in my current position.
What would require a statistical analysis would be whether there is a correlation between the ready to work population by demographic and the rates of employment in the public sector. For example, is federal sector employment related to race? Please think about the assignment in terms of identifying a relationship between variables, not counting the existence or lack thereof, of a certain demographic employed in the public sector.


