Answered You can buy a ready-made answer or pick a professional tutor to order an original one.
- Conduct a goodness of fit analysis which assesses orders of a specific item by size and items you received by size.1. Conduct a hypothesis test with the objective of determining if there is a differ
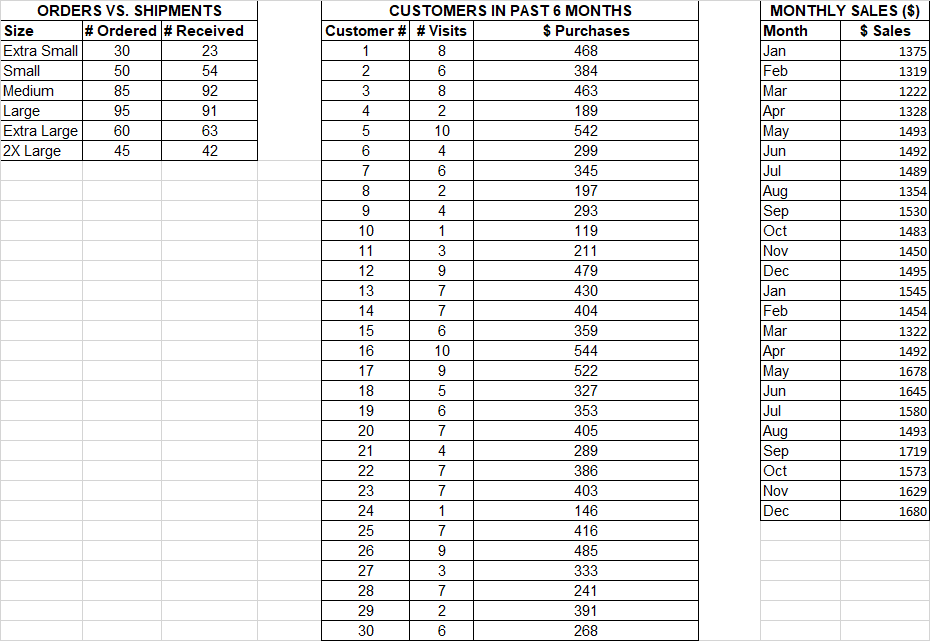
- Conduct a goodness of fit analysis which assesses orders of a specific item by size and items you received by size.
1. Conduct a hypothesis test with the objective of determining if there is a difference between what you ordered and what you received at the .05 level of significance.
2. Identify the null and alternative hypotheses.
- Generate a scatter plot, the correlation coefficient, and the linear equation that evaluates whether a relationship exists between the number of times a customer visited the store in the past 6 months and the total amount of money the customer spent.
3. Set up a hypothesis test to evaluate the strength of the relationship between the two variables.
4. Use a level of significance of .05.
-In the Data Analysis Toolpak, use Excel's Exponential Smoothing option.
5. Apply a damping factor of .5, to your monthly sales data.
6. Create a new time series graph that compares the original and the revised monthly sales data.
7. Reference the time series graph comparing original and revised monthly sales data. What is the adjusted amount for year 1 May? Hint: (=0.5*Sales+0.5*Previous month's adj sales)
8. Reference the time series graph comparing original and revised monthly sales data. What is the adjusted amount for year 2 May? Hint: (=0.5*Sales+0.5*Previous month's adj sales)
- @
- 190 orders completed
- ANSWER
-
Tutor has posted answer for $20.00. See answer's preview
****** download the ***********