Answered You can hire a professional tutor to get the answer.
QUESTION
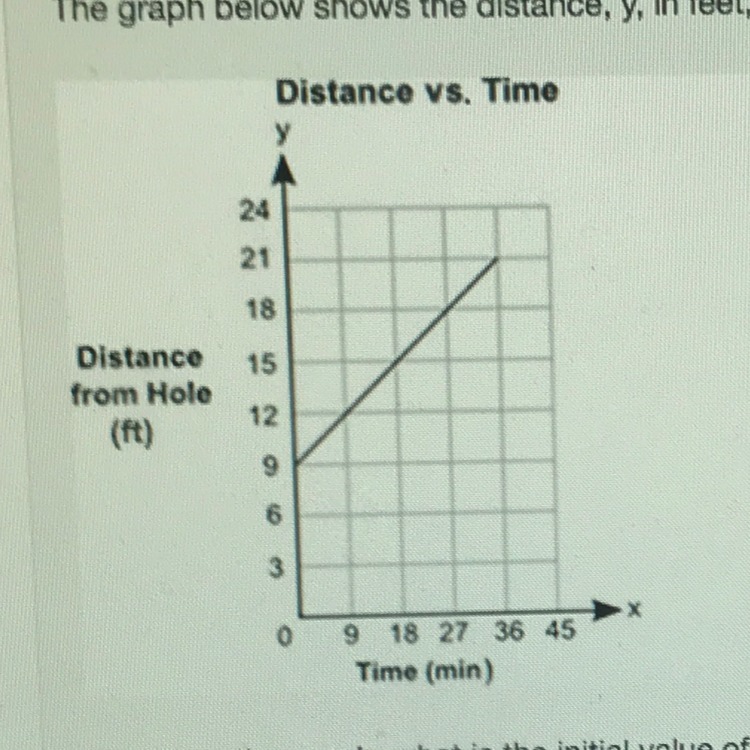
*PLEASE ANSWER ASAP* The graph below shows the distance, y, in feet, of a mouse from its hole, for a certain amount of time, x, in minutes: Based on the graph, what is the initial value of the graph
*PLEASE ANSWER ASAP*
The graph below shows the distance, y, in feet, of a mouse from its hole, for a certain amount of time, x, in minutes:
Based on the graph, what is the initial value of the graph and what does it represent?
0.23 foot per minute; it represents the speed of the mouse
9 ft; it represents the original distance or the mouse from its home
0.23 foot; it represents the original distance of the mouse to its hole
9 feet per minute; it represents the speed of the mouse
*please explain how you got 9 or 0.23*
Files:
n8gn32qdzw.jpg
