Answered You can buy a ready-made answer or pick a professional tutor to order an original one.
Bar graph problem
Bar graph problem
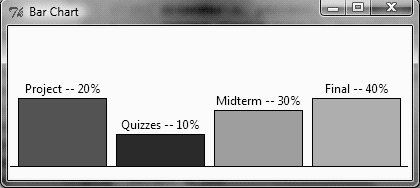
Write a program that uses a bar chart to display the percentages of the overall grade represented by the prject, quizzes, the midterm exam and the final exam. Suppose that the project is 20 percent of the grade and its value is displayed in red, quizzes are 10 percent and displayed in blue, the midterm exam is 30 percent and is displayed in green, and the final exam is 40 percent and is displayed in orange.
- @
- 13 orders completed
- ANSWER
-
Tutor has posted answer for $15.00. See answer's preview
*************** *********************************** *********************** javafxscenechartBarChart;import javafxscenechartCategoryAxis;import *****************************