Answered You can hire a professional tutor to get the answer.
QUESTION
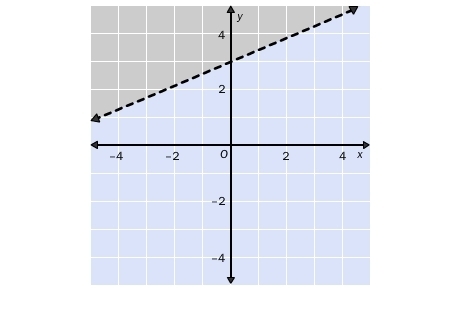
Choose the linear inequality that describes the graph. The gray area represents the shaded region. 3x – 7y < –21 3x – 7y > –21 3x – 7y < 21 3x + 7y < –21
Choose the linear inequality that describes the graph. The gray area represents the shaded region.
3x – 7y < –21
3x – 7y > –21
3x – 7y < 21
3x + 7y < –21
Files:
i494z2uqxn.jpg
