Waiting for answer This question has not been answered yet. You can hire a professional tutor to get the answer.
QUESTION
Consider the table below, Network Diagram Data for a Small Project. All duration
Consider the table below, Network Diagram Data for a Small Project. All duration estimates or estimated times are in days; and the network proceeds from Node 1 to Node 9.
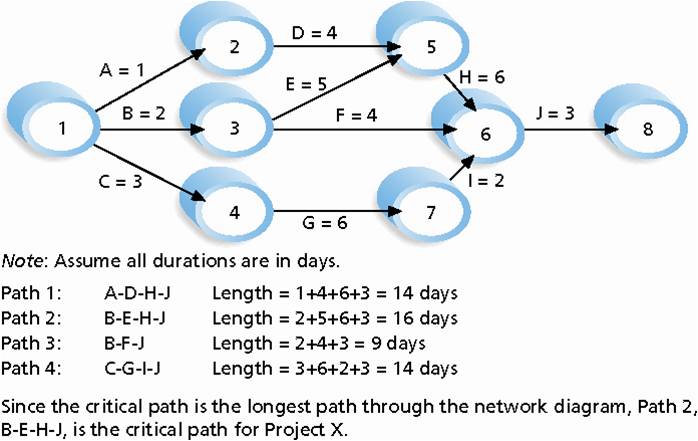
- Draw an AOA network diagram representing the project. Put the node numbers in circles and draw arrows from node to node, labeling each arrow with the activity letter. MS Powerpoint or Visio are good tools for this task.
- Identify all of the parts on the network diagram and note how long they are, using Figure 6-8 in your text as a guide for how to represent each path.
- What is the critical path for this project and how long is it?
- When is the earliest possible time that this project can be completed?
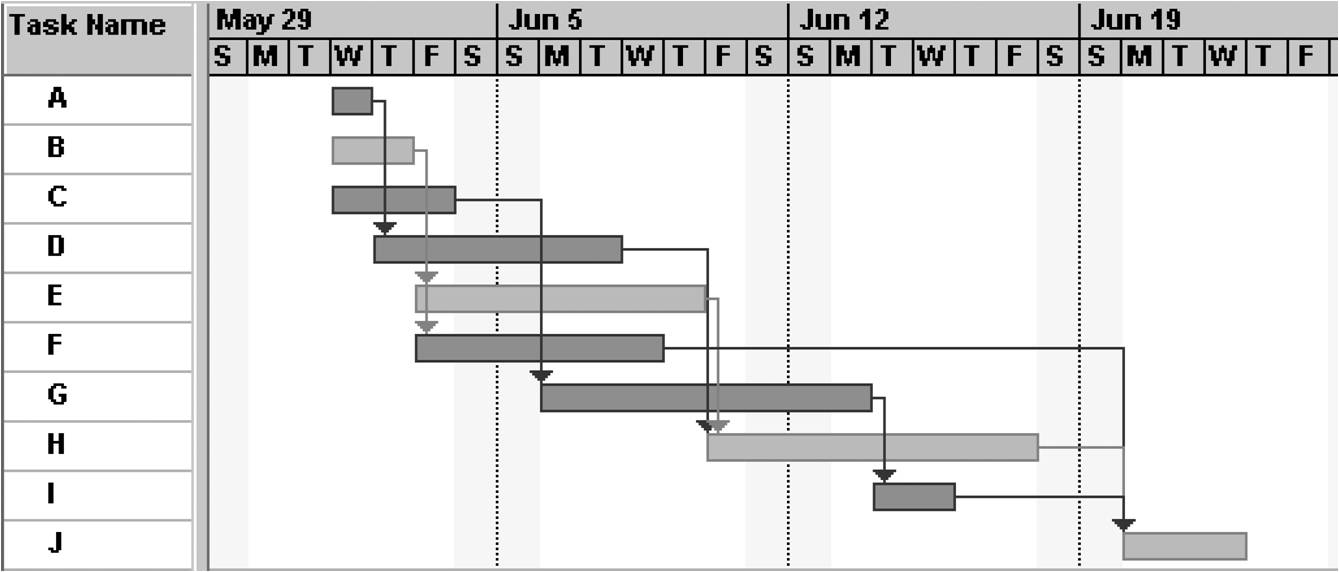
- Enter the information into MS Project.
Activity
Initial
Node
First
Node
Estimated
Duration
A
1
2
2
B
2
3
2
C
2
4
3
D
2
5
4
E
3
6
2
F
4
6
3
G
5
7
6
H
6
8
2
I
6
7
5
J
7
8
1
K
8
9
2
Example AOA diagram and Gantt Chart.
AOA Diagram.jpgGantt Chart.jpg
