Waiting for answer This question has not been answered yet. You can hire a professional tutor to get the answer.
Geography
Lab #2: Sun Angles, Daylength, Insolation, and Temperature Patterns
Insolation
The sun is the single most important source of energy on the surface of the Earth as well as the atmosphere. The distribution of the Earth’s atmospheric phenomena and climate patterns, as well as the distribution of its ecosystems, are significantly influenced by the distribution of incoming solar radiation. In heating the Earth’s atmosphere, visible light is the most important part of the sun’s electromagnetic spectrum. This exercise examines sun angle and intensity of insolation, daylength and temperature patterns on the earth’s surface. These variables are examined as they interrelate on the Earth’s surface over the course of a year.
Sun Angle
Because solar energy received by the earth follows essentially parallel pathways, and because the earth is spherical, at only one place on the earth’s surface can the sun’s rays strike vertically (this is known as the subsolar point). In other words, at only one place at any one time can the sun appear directly overhead. This occurs at solar noon when the sun reaches the highest position in the sky for that day. Because of the earth's limited axial tilt, the sun can appear directly overhead at the subsolar point at a relatively narrow range of latitudes over the course of a year (between 23.5° N and 23.5° S).
An important relationship exists between latitude and the angle of the noon sun. On the equinoxes (on March 21 or 22 and September 21 or 22) the sun’s rays are perpendicular to the earth at the equator. Those same rays would also be tangent at both of the poles, so that the sun would appear only on the horizon at those locations. On the same dates an observer at 30° N would record a sun angle of 60° above the southern horizon. Remember, the sun is 90° to the observer at the equator, minus the latitude of 30° (30° of arc) which equals 60°. This is called the angle of incidence, or sun angle. The angle of incidence decreases by 1° for every degree of arc of latitude between the observer's position and the location where the sun’s rays are vertical. This rule is the same for the other times of the year but is complicated by the earth's declination–the shift in angle when the sun's rays are not perpendicular to the equator. If the declination is 10° S, this means that the sun's rays are vertical at 10° S and an observer at 30° N would see the sun at 50° above the horizon 90-40 or 90-(30+10).
Use the formula:
angle of incidence = 90° - (latitude in degrees + declination in degrees*)
* If the declination is in the same hemisphere as the observer, subtract this from latitude.
Example:
Seattle (47° N) on December 21 (23.5° S) would be:
90° - (47 + 23.5)
90° - (70.5) = 19.5°
Thus the angle of incidence for Seattle on December 21 is 19.5°
Note: Keep in mind that solar noon is not the same as noon on our clock or watch because we are on standard time and typically, daylight savings time. In the summer months in the U.S. solar noon is found around 1:00 pm.
1) For the locations listed below, calculate the solar noon sun angle (angle of incidence) for the following locations on the days listed. You should be able to figure out the sun’s declination for December 21, June 21, and September 21! (.5 points per angle, total of 5 points).
The sun's declination for: October 9 = 6° S
February 5 = 16° S
April 20 = 11° N
El Paso, Texas (32° N) on: February 5___
September 21___
Honolulu, Hawaii (19° N) on: April 20___
June 21___
Seattle, Washington (47° N) on: December 21___
October 9____
Nome, Alaska (65° N) on: December 21___
June 21___
Green River, Utah (39° N) on: September 21___
February 5___
Of the dates and locations provided above, which two would be best for getting a good suntan assuming clear skies? (1 pt)
Length of Daylight
Another factor in the spatial variation of insolation is length of daylight in a 24-hour period. Because of the Earth-Sun relationship and the spherical nature of the earth, low latitudes differ greatly from high latitude in the amount of time they spend in the circle of illumination. Examine the pattern of sunlight, latitude and time of year on Table 1.
Duration of Sunlight in the Northern Hemisphere
Table 1
Latitude
Northern Hem. Summer Solstice
Equinoxes
Northern Hem. Winter Solstice
90° N
24:00 hours
sun on horizon
0:00
80° N
24:00
12:00 hours
0:00
70° N
24:00
12:00
0:00
66.5° N
24:00
12:00
0:00
60° N
18:27
12:00
5:33
50° N
16:18
12:00
7:42
40° N
14:52
12:00
9:08
30° N
13:56
12:00
10:04
23.5° N
13:25
12:00
10:35
20° N
13:12
12:00
10:48
10° N
12:35
12:00
11:25
0°
12:06
12:00
11:54
2) Answer the following questions using Table 1.
a) What is the approximate daylength (time in the circle of illumination) for Sao Paulo, Brazil (23.5° S) on June 21? (1 point)
b) What is the approximate daylength (time in the circle of illumination) for Philadelphia, Pennsylvania (40° N) on December 21? Compare this with Oslo, Norway (60° N) on the same day. How much do they differ in hours and minutes? (2 points)
Spatial Patterns of Insolation
As one might expect, changing sun angle and daylength results in a distinct pattern of insolation by latitude over the course of a year. This pattern is shown in Figure 1. Figure 1 illustrates insolation levels, as measured in watts per square meter (watt/m2), at the top of the atmosphere.
Figure 1
3) Answer the following questions using Figure 1.
a) How much does Seattle’s latitude receive in insolation on February 1, approximately? (1 point)
b) Between approximately what dates (specify approximate date and month) does Seattle’s latitude receive more than 450 watts/m2 in insolation? (1 point)
c) Which latitude receives the greatest variation in insolation over the course of a year? How much is this variation in watts/m2? (2 points)
Spatial Patterns of Temperature
Temperatures vary across the Earth's surface as a result many factors. The most important of these are: insolation, altitude, cloud cover and distance from large bodies of water. To show the spatial variation of phenomena such as temperature, geographers use maps that employ isolines that connect points of equal value. Isolines used to depict temperature are known as isotherms. Similarly, isolines used to show pressure are called isobars, and isolines for precipitation are known as isohyets.
To construct a map using isolines we need a large number of observations (over space) that have been made at locations such as surveyed landforms or weather stations. These places or points of observation are known as control points. Intermediate values between control points can be easily calculated to create a continuous surface of data.
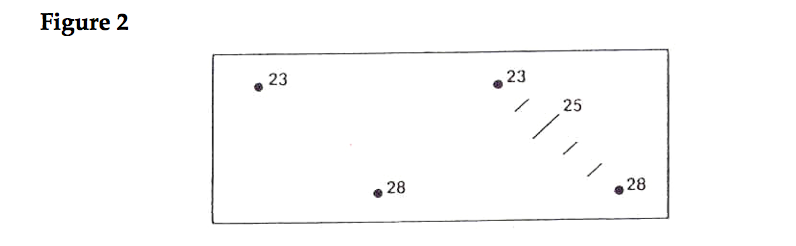
As mentioned above, with continuous phenomena like elevation or temperature, we can plot intermediate values between known control points where data has been collected. Positioning the intermediate values assumes uniform intervals (spacing values at equal distances) and is called interpolation. For example, a point located halfway between two control points would be estimated as being halfway between two control points. See Figure 2 for an example.
Figure 2
4) Map 1 is a surface temperature map in degrees Celsius (C°) for the United States. Temperatures were recorded at 7:00 am EST on October 30, 1993. Draw the appropriate isotherms at 5° C intervals on Map 1. Note that the 0° C (32° F) isotherm is already drawn for you. Use a pencil to light sketch the isotherms based on your interpolation. Later, when all the lines are complete, darken or color the lines, which should be smooth curved lines. Begin with the
–5° C isotherm, then draw the –10° C, -15° C then the 5° C, 10° C, 15° C, etc. (5 points)
5) Answer the following questions based on your isotherms drawn on Map 1.a) If temperatures were entirely a result of latitude, isotherms would run directly east-west. Do the isotherms on your map run east-west? What factors affect the isotherm pattern you are observing? (5 points)
b) Compare the temperature gradients (how close the isotherms are to each other) over Nevada/Utah and the southeastern US (Georgia/South Carolina/Florida). Are the gradients the same or different? What factors could account for what you observe for the temperature gradients in these two different areas? (5 points)
c) What is the temperature range on this map (i.e. calculate the difference between the maximum and minimum temperature reading)? In the spaces below, fill in the temperature readings in both Celsius and Fahrenheit; use a map, atlas or the internet to determine the city (weather station) where the data was collected. (2 points)
Maximum temperature: _____C, _____ F Station_________
Minimum temperature: _____C, _____ F Station_________
Range in temperature between the highest and lowest temperatures on the map: ________C, ________ F
Map 1