Answered You can hire a professional tutor to get the answer.
QUESTION
HeRe ArE yOuR pOiNtS! Come and Get them! The graph shows a predicted population as a function of time. Choose the one statement below that is true about this graph. The graph shows the population decr
HeRe ArE yOuR pOiNtS! Come and Get them!
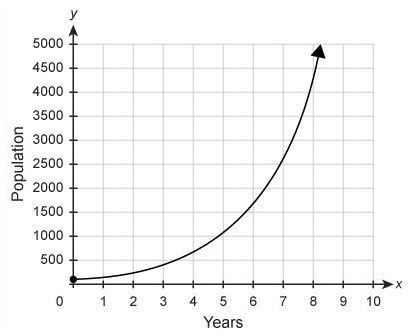
The graph shows a predicted population as a function of time.
Choose the one statement below that is true about this graph.
The graph shows the population decreasing without bound.
The initial population was less than 500.
Based on the graph, it is predicted that it will take more than 5 years for the population to be greater than 500.
The graph has an x-intercept and a y-intercept.
The graph shows quadrant II because only negative x-values make sense for this situation.
Files:
82d0922fyt.jpg
