Waiting for answer This question has not been answered yet. You can hire a professional tutor to get the answer.
QUESTION
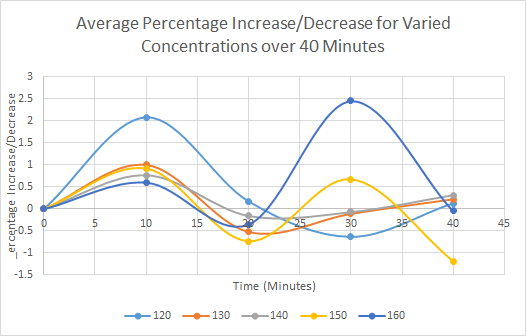
Hi, i am unsure what this specific graph is telling me from results collected. It is in relation to osmosis and osmoregulation within dialysis tubes and change in concentrations in salt. For example,
Hi, i am unsure what this specific graph is telling me from results collected. It is in relation to osmosis and osmoregulation within dialysis tubes and change in concentrations in salt. For example, why does the 120mL concentration increase at an earlier rate than the 160mL? Why do the other concentrations not increase at similar levels, but rather stay flatter?
