Waiting for answer This question has not been answered yet. You can hire a professional tutor to get the answer.
I need this by tomorrow
Objectives:
Create an Excel workbook with external resourcesDesign a basic report tableApply professional formatting to a data tablePrepare an Excel document for printingEnter and format date dataConstruct basic formulas
Step 1: Gather the data
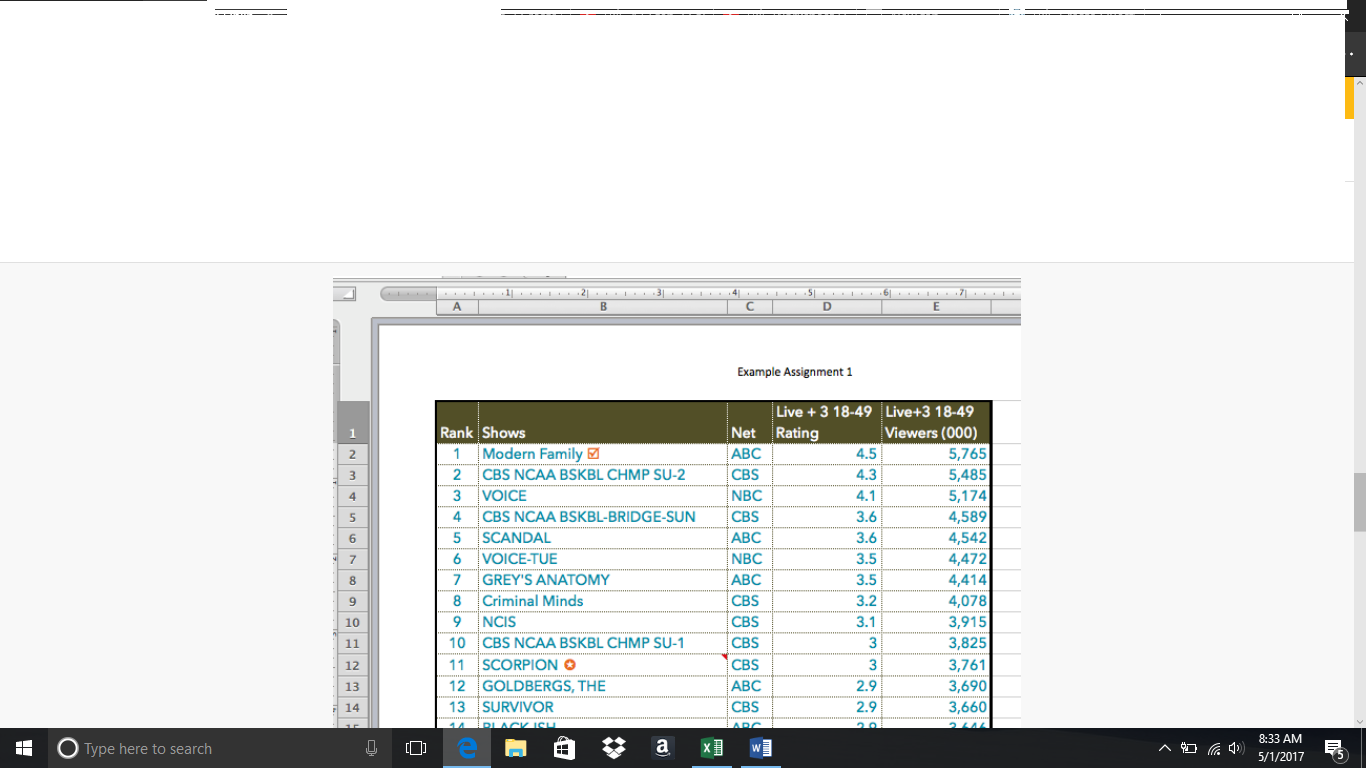
Research and locate any data you are interested in for the entertainment industry, or alternatively, research demographics information you feel are related to the industry.Your data must be different from other classmates. Review post summaries completed before yours to ensure there is no duplication.
The data should be a minimum of 1 column x 5 rows (or 5 columns by 1 row) and should include numbers/currency that can be calculated with a formula.
Step 2: Start the workbook and create formulas
- Copy the data from the original source in your research.
- In a new Excel workbook, paste the data with the data collected using the Paste Special option in the Edit Menu item.
- Choose Paste “Values” or Paste “Unicode Text” (Option of Values / Unicode Text will vary depending on data collected). Note: If data does not copy/paste easily into the document, it may need to be hand-typed.
- Using the data collected: Create at least 2 unique formulas or functions to analyze the data.
Below is a tutorial discussing how to bring the data into Excel.
*****PLEASE LOOK AT THE VIDEO******
Below is a video discussing the creation of the formulas.
https://www.youtube.com/watch?v=FPBJQlFczGU
*****PLEASE LOOK AT THE VIDEO*****
https://www.youtube.com/watch?v=bs0csk9B1i8
- Step 3: Format the data set
Formatting should include:
- Change at least one font color
- Change at least one font size
- Change at least one type of font
- Apply a background fill to your labels for the categories
- Addition of borders
- Professional alignment of text and/or numbers
- Formatting of currency if appropriate. For any number over 1,000 that is not currency, there should be commas with no decimals
- Resizing of columns or rows if necessary to ensure all data and categories can be viewed easily
- Insert at least two symbols with the Excel symbol browser to help emphasize areas of interest in your data
****PLEASE LOOK AT THE VIDEO*****
https://www.youtube.com/watch?v=QvCtt-tqu_Q
Step 4: Worksheet Design Guidelines
- File saved with assignment number and first name, last initial. For example: A1AprilW.xlsx
- Headers contain name of Assignment (unless otherwise instructed) on each worksheet.
- Footers contain creation date, last opened date, and student’s name on each worksheet. Creation date is hand-typed. Opened date will change every time assignment is opened.
- Excess sheets removed (no unused extra tabs)
- Each tab contains short worksheet name (renamed, should not be: Sheet1 or Chart1, etc)
- Cell formatting appropriate: text and number formatting correctly used and appropriate to the scenario. Financial figures should have currency or accounting format. Figures over 100havenodecimals.Figuresunder 100 will show two decimals.
- No cells contain errors (all green triangle cells resolved)
- At least one cell comment on each worksheet to document notes from class OR to emphasize outcomes (explain why you chose a certain formula, certain data or explain the outcome of data analysis)
- Designed for both Normal and Page Layout views but delivered in Page Layout view with the correct perspective chosen (either portrait or landscape) - ensure that neither data nor charts cross page breaks (one page wide).
Here is a refresher on the worksheet design guidelines.
Note: this is the same video from the month-long tutorials area if you already viewed it.
Step 5: Submission
In the discussion board area:
- Provide a brief explanation to other students of the data you selected. Include details such as time frame pulled, subject area, basic content of the data.
- In at least one paragraph, describe how you feel the data you selected relates to your field of interest.
- Include a citation/reference for the data source.
- Upload the spreadsheet to the Assignment 1 discussion board as an attachment.
