Waiting for answer This question has not been answered yet. You can hire a professional tutor to get the answer.
Question Refer chart> As the chart shows, workers age 25 and over who have less education than a high school diploma had the highest unemployment rate (5.4 percent) and lowest median weekly earning
Question
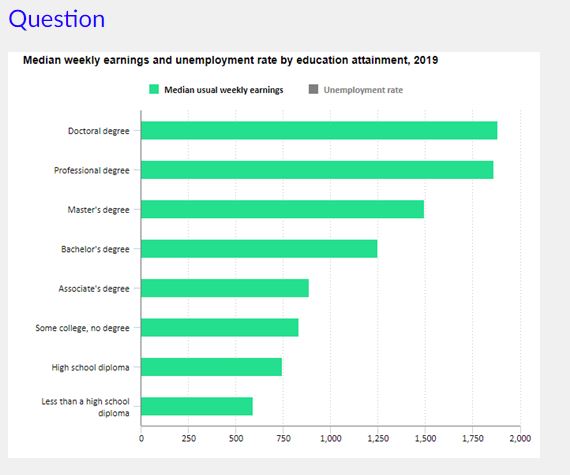
Refer chart>
As the chart shows, workers age 25 and over who have less education than a high school diploma had the highest unemployment rate (5.4 percent) and lowest median weekly earnings ($592) in 2019 among those at all education levels. Workers with graduate degrees had the lowest unemployment rates and highest earnings.
These data come from the Current Population Survey Links to an external site., a monthly survey that collects information about the labor force, including age, sex, marital status and other characteristics.
Each level of education you complete may help you develop more skills, give you access to higher paying occupations, and signal that you’re able to follow through on important tasks, such as planning ahead and meeting deadlines, that employers value.
Other factors affecting employment and earnings include geographic location, experience, and sector worked. Data and information can help you understand some of these factors.
The objective of this study will explore some of the issues that arise in this context using data from the CPS, the Current Population Survey Links to an external site. on education level and wages.
Load the data (cps.csv) from Microsoft Excel and transform into SPSS.
It is also possible to address problems where there are more than 2 treatments, e.g. look at the effect of race, sex and location on wage. Things start to get more complicated, of course, but it can be done. Particularly confusing is the fact that you can have 3-way and higher interactions, and it can be difficult to interpret what these mean.
The variables are:
- wage: monthly income/payment in RM (‘000)
- educ: highest educational level
- race: ethnicity of respondent (M= Malay, C= Chinese, I = Indian, O = other)
- sex: gender of respondent (M =male, F = female)
- location: work place location (1 = north, 2 = east, 3 = west, 4 = south)
- married: marital status (married or single)
- experience: year of working experience
- union: register with union
- age: respondent's age in years (union or not)
- sector: working sector (professional, management, sales, clerical, service, manufacturing, other)
Construct an ANOVA table and conduct F-tests for the presence of nonzero educational effects, road experience effects, and interaction effects.
Tables, Graphs, Figures – You can include tables of data referred to in the text. The source(s) of the data should be noted on the table. Be sure to explain the significance of these data in the body of the paper. You can also include graphs or charts to illustrate your paper. The source(s) of the data to construct these aids must be noted below the illustrations.
Style – To adequately achieve the objectives of the assignment, 3,300 words of content (excluding figures and diagram) are probably required.
Note:-
a) Your citation must be from credible journal listed in Science Direct or Emerald Insight. The age of the journal should be not later than 5 years (latest is 2016).
b) originality, professionalism.
c) American Psychological Association (APA) referencing format
