Answered You can hire a professional tutor to get the answer.
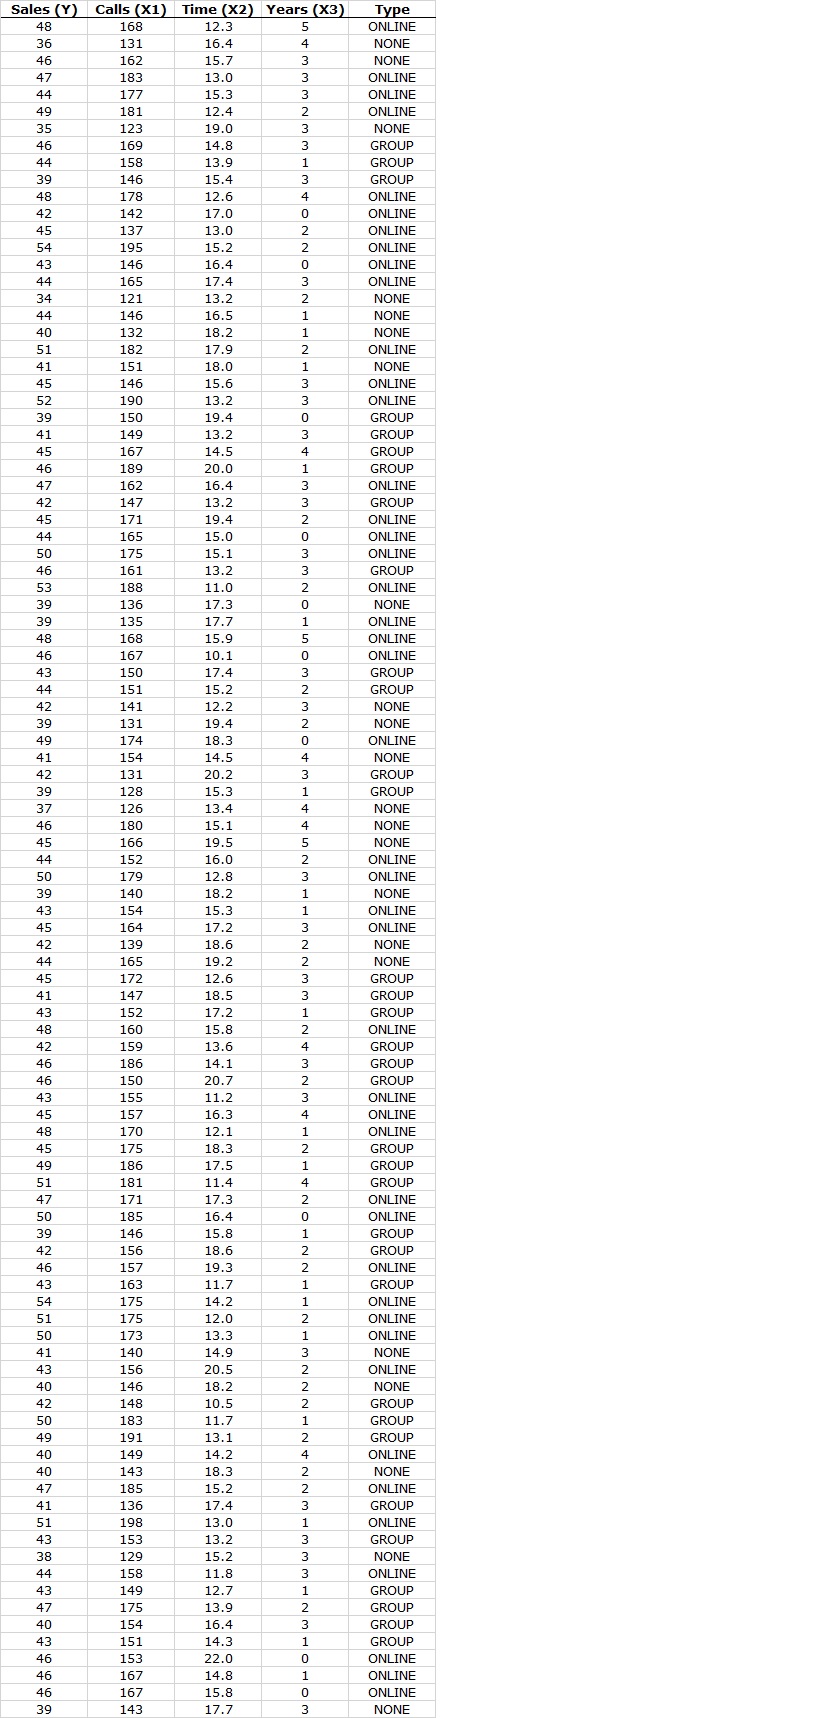
Sales ('1') Calls (x1) 'me (x2) Yeats (X3) Tune 48 168 12.3 5 ONLIME 3 6 1 3 1 16.4 4 NONE 46 162 15.7 3 NONE 47 183 13 .0 3_ ONLII'E 4j 1 77 1 5. 3...
SALES represents the number sales made this week.
CALLS represents the number of sales calls made this week.
TIME represents the average time per call this week.
YEARS represents years of experience in the call center.
TYPE represents the type of training the employee received.
Part A: Exploratory Data AnalysisPreparation
• For each of the five variables, process, organize, present and summarize the data. Analyze each variable by itself using graphical and numerical techniques of summarization. Use Excel as much as possible, explaining what the results reveal. Some of the following graphs may be helpful: stem-leaf diagram, frequency/relative frequency table, histogram, boxplot, dotplot, pie chart, bar graph. Caution: not all of these are appropriate for each of these variables, nor are they all necessary. More is not necessarily better. In addition be sure to find the appropriate measures of central tendency, the measures of dispersion, and the shapes of the distributions (for the quantitative variables) for the above data. Where appropriate, use the five number summary (the Min, Q1, Median, Q3, Max). Once again, use Excel as appropriate, and explain what the results mean.
• Analyze the connections or relationships between the variables. There are ten (10) possible pairings of two (2) variables. Use graphical as well as numerical summary measures. Explain the results of the analysis. Be sure to consider all 10 pairings. Some variables show clear relationships, whereas others do not. Report Requirements
• From the variable analysis above, provide the analysis and interpretation for three individual variables. This would include no more than one graph for each, one or two measures of central tendency and variability (as appropriate), the shapes of the distributions for quantitative variables, and two or three sentences of interpretation.
• For the 10 pairings, identify and report only on three of the pairings, again using graphical and numerical summary (as appropriate), with interpretations. Please note that at least one pairing must include a qualitative variable, and at least one pairing must not include a qualitative variable.
• Prepare the report in Microsoft Word, integrating graphs and tables with text explanations and interpretation Submission: The report, including all relevant graphs and numerical analysis along with interpretations Format for report:
1. Brief Introduction
2. Discuss the first individual variable, using graphical, numerical summary and interpretation.
3. Discuss the second individual variable, using graphical, numerical summary and interpretation.
4. Discuss the third individual variable, using graphical, numerical summary and interpretation.
5. Discuss the first pairing of variables, using graphical, numerical summary and interpretation.
6. Discuss the second pairing of variables, using graphical, numerical summary and interpretation.
7. Discuss the third pairing of variables, using graphical, numerical summary and interpretation.
8. Conclusion
