Waiting for answer This question has not been answered yet. You can hire a professional tutor to get the answer.
Suppose that bikers arrive to Station 1 (station id =1) according to a nonstationary Poisson process. Complete the below table of arrival rates at Station 1. Copy and paste your Excel worksheet.HINT--
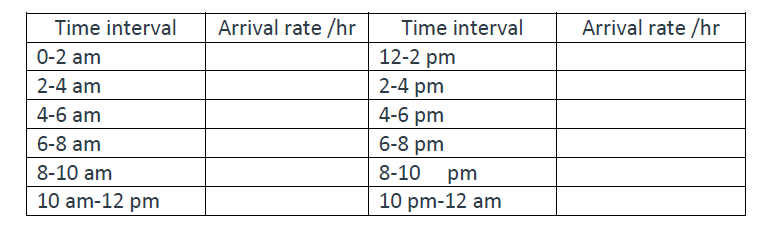
Suppose that bikers arrive to Station 1 (station id =1) according to a nonstationary Poisson process. Complete the below table of arrival rates at Station 1. Copy and paste your Excel worksheet.
HINT---Create a timevalue column. Excel ‘Timevalue (time text)’ returns the decimal number of the time represented by a text string. The decimal number is a value ranging from 0 (zero) to 0.99988426, representing the times from 0:00:00 (12:00:00 AM) to 23:59:59 (11:59:59 P.M.). For example, TIMEVALUE("1-June-2017 6:35 AM") = 0.2743. Use the histogram of the timevalue to compute the arrival rates.
The next step is to assign a destination (end station id) to each arrival at Station 1 by using a discrete probability distribution of this form:
