Answered You can hire a professional tutor to get the answer.
The figure below is a plot of temperature vs time, after adding 1 ice cube to hot water at t = 0, averaged over three trials. Data was collected at...
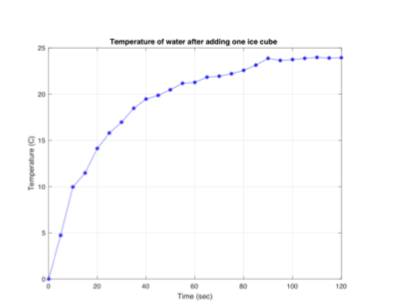
1.The figure below is a plot of temperature vs time, after adding 1 ice cube to hot water at t = 0, averaged over three trials. Data was collected at 5-second intervals. The original data has been reflected over the X-axis and the initial temperature, which was 55◦C, has been added to all the data points, such that the initial temperature is now 0. This was done to convert the data from a decaying exponential to a saturated growth exponential so that the system can be modeled as a first order system with a step input.
(a) Calculate using the above figure:
i. The time constant
ii. The rise time
iii. The settling time
(b) Obtain the transfer function for the above first order system assuming a unit step input.
(c) Use the transfer function obtained in part (b) to predict the output after a second ice cube is added at t = 120.
(d) The figure below shows empirical data collected after the second ice cube was added at t = 120. Compare and comment on the predicted output and the actual output. What could be happening at t = 125?
