Waiting for answer This question has not been answered yet. You can hire a professional tutor to get the answer.
The manager of the injection molding department has asked you to prepare an EWMA chart for a maintenance operation-weekly mold changes. The table of data below shows the number of mold changes for the
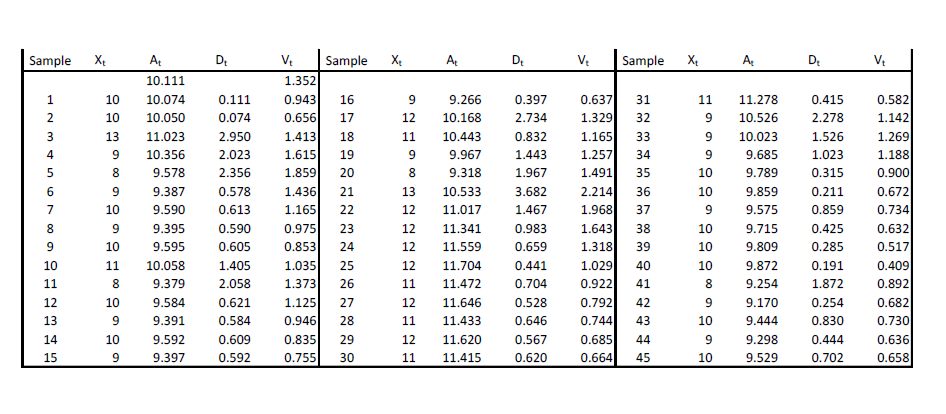
The manager of the injection molding department has asked you to prepare an EWMA chart for a maintenance operation-weekly mold changes. The table of data below shows the number of mold changes for the last 45 weeks. Construct EWMA charts using r = 0.33. Identify any statistical signals on the charts or other trend like patterns. What can you report to the manager about the mold-changing process? Make sure your report includes the following: estimates of the process mean and standard deviation, exponentially weighted moving averages, control limits and centerlines, EWMA Control Charts, and comments to the manager. or
same questions easy to undesrtnade find these function:
Calculate estimates of the process mean and standard deviation
Compute exponentially weighted moving averages, A_t, and exponentially weighted moving standard deviations, V_t
Calculated control limits and centerlines for A_t’s and V_t’s by (and A^*, d_2^*, D_1^*, and D_2^* given in Table 9.3
Create EWMA charts (weighed moving average and moving deviation chart)
Identify any statistical signals on the charts or other trendlike patterns. What can you report to the manager about the mold-changing process?
