Answered You can hire a professional tutor to get the answer.
QUESTION
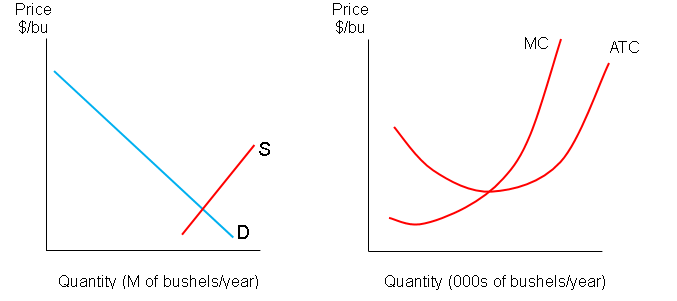
The top graph indicates a short-run situation, while the bottom graph indicates the long-run. In the graph draw the appropriate demand curve, and...
1. The top graph indicates a short-run situation, while the bottom graph indicates the long-run.
In the graph draw the appropriate demand curve, and indicate the optimal Quantity
b. Based on the graphs above, is the firm is earning an economic loss or profit (motivate)?
c. What change is expected in the market graph below (show this action in the market or industry graph below):
d. In the right side graph below, draw the new demand curve, and indicate the optimal Q
Files:
Capture.PNG
