Waiting for answer This question has not been answered yet. You can hire a professional tutor to get the answer.
QUESTION
Use Microsoft Excel to plot the relationship between pressure and height. Use the equation from part 2 to calculate atmospheric pressure from 0 km to 30 km with an interval of 0.5 km. Plot the relatio
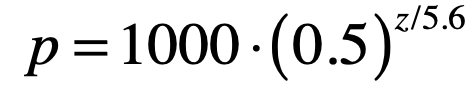
Use Microsoft Excel to plot the relationship between pressure and height. Use the equation from part 2 to calculate atmospheric pressure from 0 km to 30 km with an interval of 0.5 km. Plot the relationship between pressure (in mb) and height (in km) using a scatterplot. Use equation as reference below.
Files:
equation.png
