Answered You can hire a professional tutor to get the answer.
Use the data in the table below to answer problems 13 and 14 To receive full credit for the problems below, you must show: *The equations you used to...
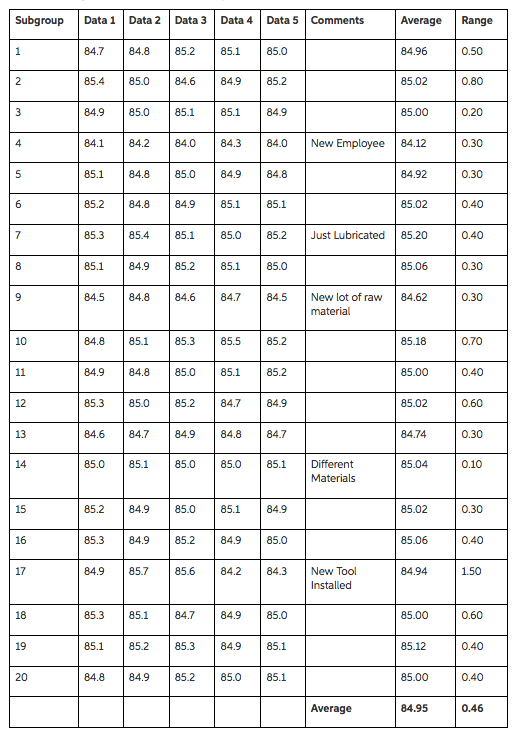
Use the data in the table below to answer problems 13 and 14
To receive full credit for the problems below, you must show:
*The equations you used to arrive at your solution.
*The numbers you substituted into those equations.
Use the information in the above table to compute the Control Limits for an Average and a Range Control Chart.
Do NOT assume assignable cause variation. If there are any subgroups out-of-control, use the "Comments" column to determine if assignable cause variation is present. Discard any subgroups that are out of control and have assignable cause variation and calculate revised Control Limits for an Average and a Range Control Chart. Only look at whether they are outside the control limit- not all the zone rules. Be sure to list any subgroups that are removed.
Subgroups removed:_________________________
15. What is your assessment of the process after your calculations in question 14 and what should you do? DO NOT ASSUME ASSIGNABLE CAUSE.
