Waiting for answer This question has not been answered yet. You can hire a professional tutor to get the answer.
Wk 3 - Response to article 1 of 2
Need by Wednesday, 10pm. 200 words minimum with references.
See attachments.
Week 3
#1
Read Chapter 3 pp.83-90 in Real-World Data Mining Applied Business Analytics and Decision Making.
Analyze the use of DMAIC in the determination of statistical patterns in process metrics.
#2
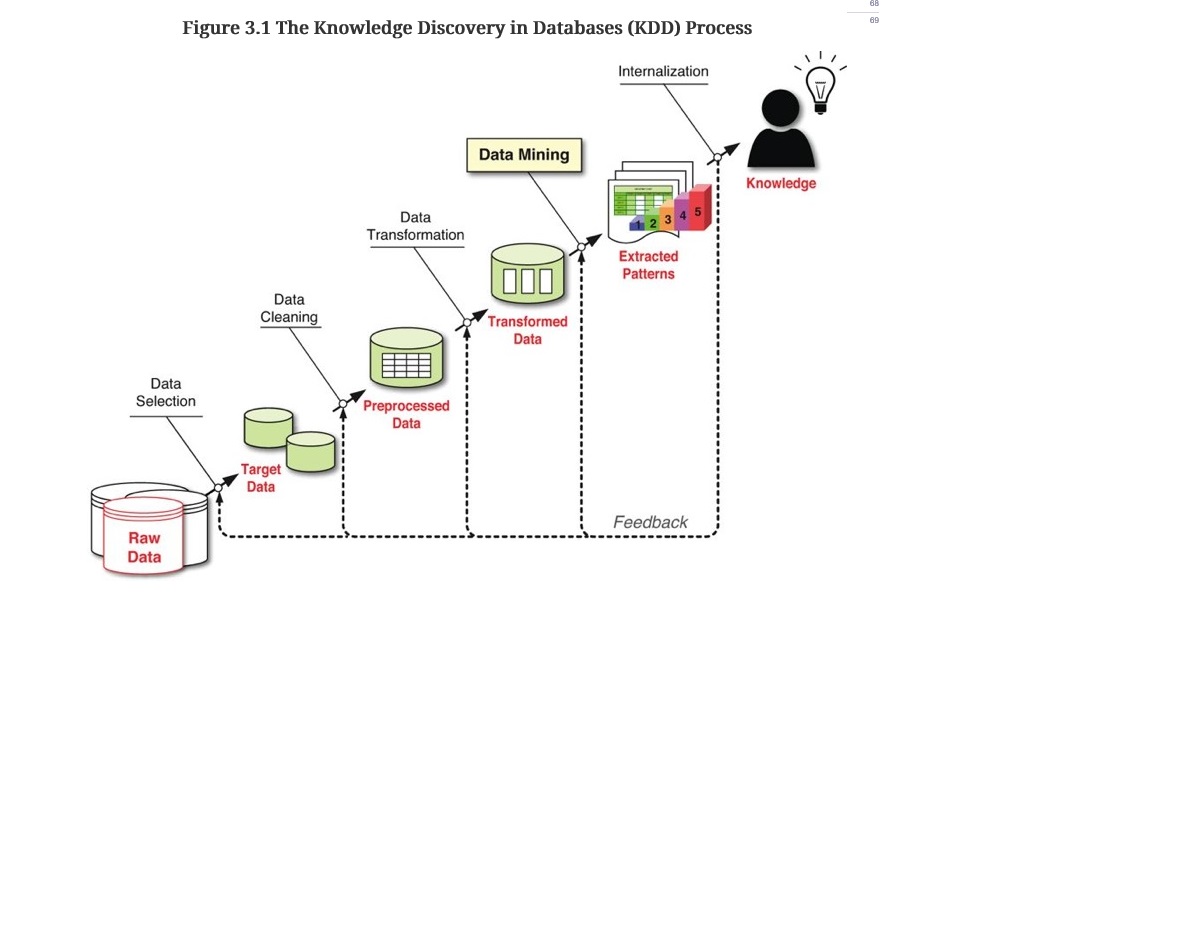
Figure 3.1
After evaluating Figure 3.1 in the text, in which step of the process are organizations likely to fall short? What would be your recommendation to an organization that falls short in this step?
See image
#3
Visual data analysis
The ERR, Slater, R. D., Beal-Hodges, M., & Reed, A. (2014). USING EXCELS PIVOT TABLE FUNCTION FOR VISUAL DATA ANALYSIS OF EXAM RESULTS: A SUPPLEMENTAL PROCEDURE TO CLASSICAL TEST THEORY. Academy of Educational Leadership Journal, 18(4), 221-229. Retrieved from http://search.proquest.com/docview/1645851108?accountid=35812, discuss the use of pivot tables as an supplement to classical test theory. What are the authors' arguments for the use of a visual data analysis? Do you agree with their findings? Why or why not?
#4
Cross Tabulate Your Data – Electronic Reading Response.
See attachment.
