Waiting for answer This question has not been answered yet. You can hire a professional tutor to get the answer.
QUESTION
'Output [Document] - IBM SPSS Smtistics Viewer Eie gar \_liew gar: Iransform insert Fgmar Analyze graphs mines Eigensions MM! HERD 5.1%, e 1%...
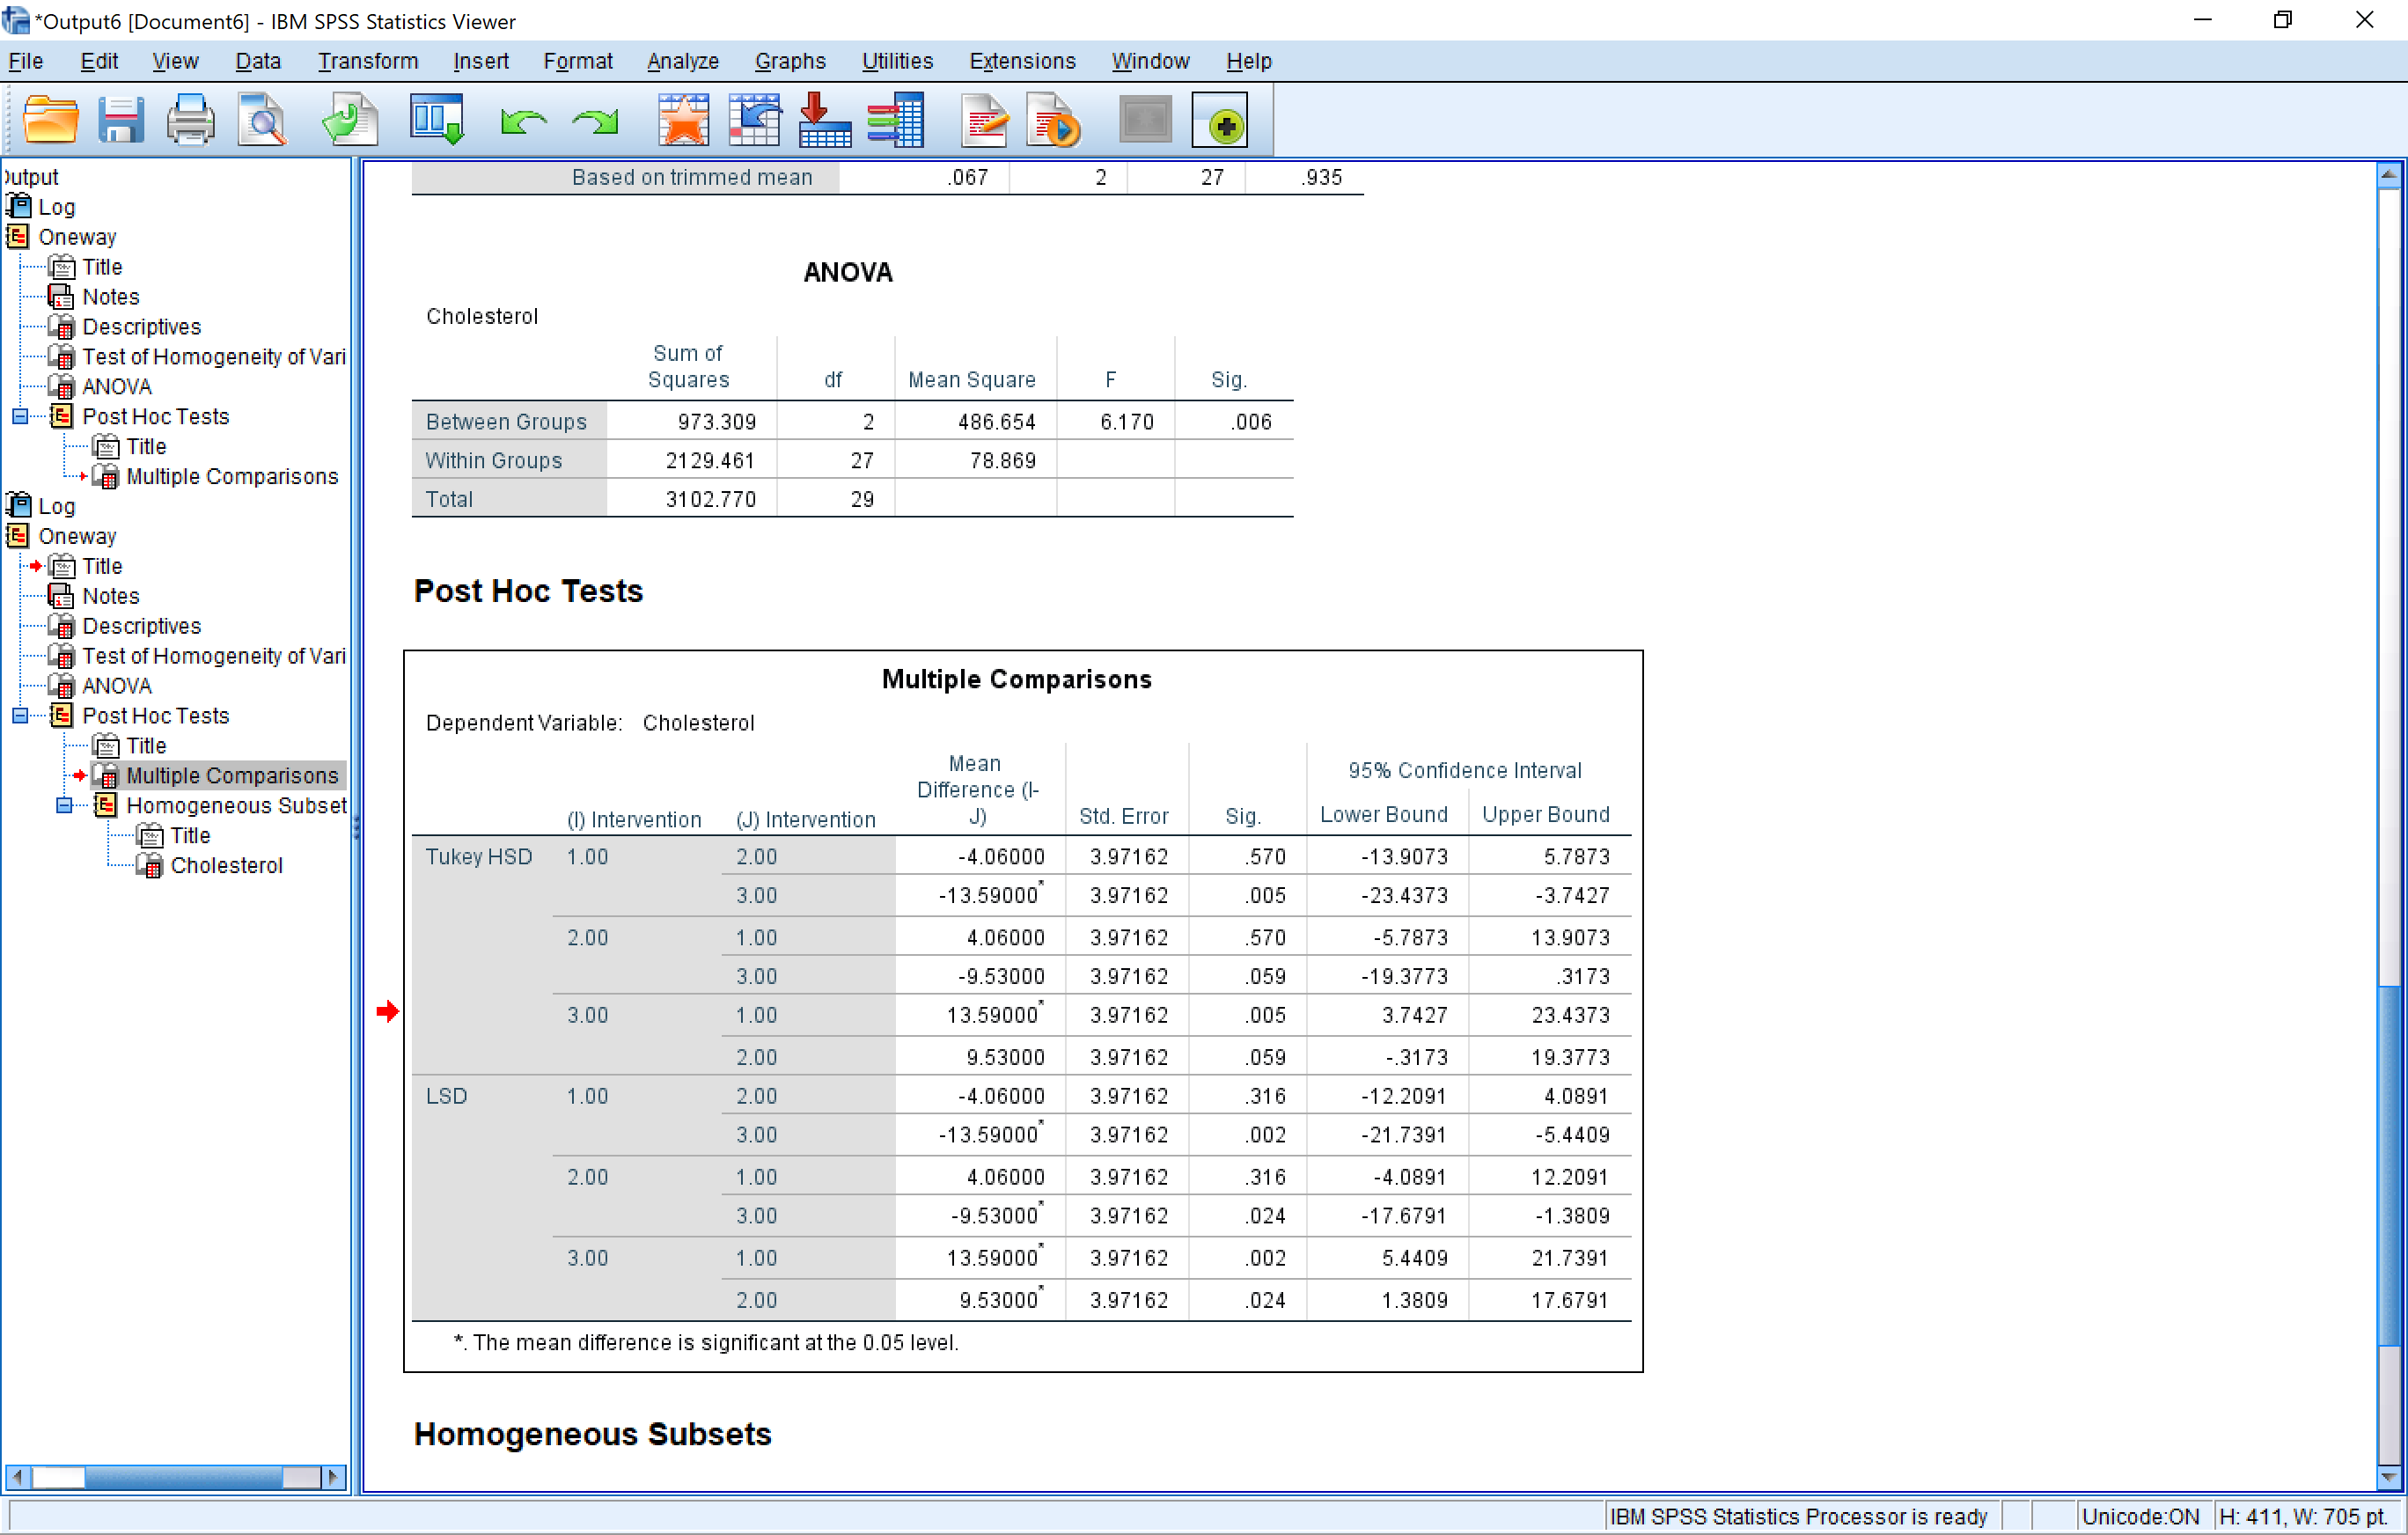
Two variables= intervention and cholesterol. Intervention has three groups: Low fat food=1, Physical activity=2, and PA+low fat food =3
I need assistance describing the results of the analysis. I know that I need to state the hypothesis, mean and SD for each group, F value, df, significance, and post-hoc tests results. I also need help deciding if you conclude that there are significant differences in cholesterol reduction due to intervention type.
Files:
2018-07-06 (1).png
