Answered You can buy a ready-made answer or pick a professional tutor to order an original one.
1) Create a plot in Excel that looks like the above plot (as close as you can get it, namely: color, range, number size, and direction of the x-axis). 2) What is the total area under this curve? 3) Wh
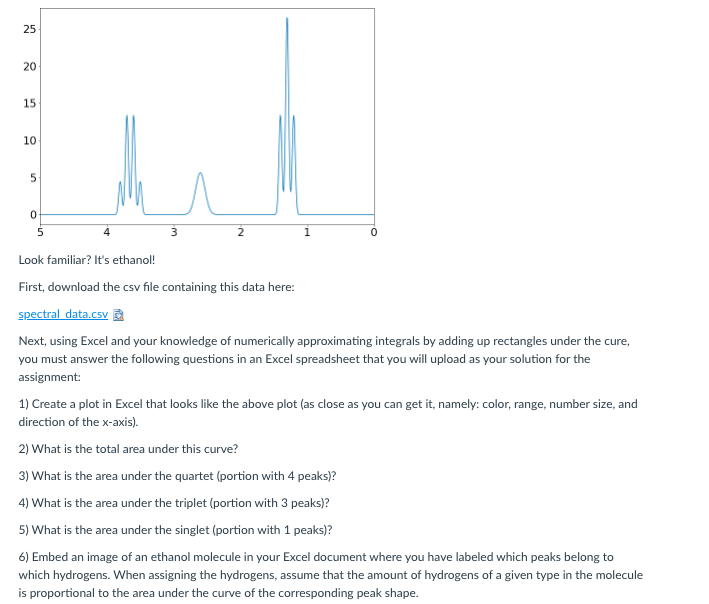
1) Create a plot in Excel that looks like the above plot (as close as you can get it, namely: color, range, number size, and direction of the x-axis).
2) What is the total area under this curve?
3) What is the area under the quartet (portion with 4 peaks)?
4) What is the area under the triplet (portion with 3 peaks)?
5) What is the area under the singlet (portion with 1 peaks)?
6) Embed an image of an ethanol molecule in your Excel document where you have labeled which peaks belong to which hydrogens. When assigning the hydrogens, assume that the amount of hydrogens of a given type in the molecule is proportional to the area under the curve of the corresponding peak shape.
Thank you in advance
- @
- 5005 orders completed
- ANSWER
-
Tutor has posted answer for $20.00. See answer's preview
****** ***** *** ********** below and ***** Thank ***