Answered You can buy a ready-made answer or pick a professional tutor to order an original one.
1) Late payment of medical claims can add to the cost of health care. Suppose 72.6% of the claims were paid in full when first submitted for one insurance company. The insurance company developed a n
1) Late payment of medical claims can add to the cost of health care. Suppose 72.6% of the claims were paid in full when first submitted for one insurance company. The insurance company developed a n
1) Late payment of medical claims can add to the cost of health care. Suppose 72.6% of the claims were paid in full when first submitted for one insurance company. The insurance company developed a new payment system in an effort to increase this percentage. A sample of 270 claims processed under this system revealed that 202 of the claims were paid in full when first submitted. Complete parts a and b below.Based on the sample data, test the null hypothesis using an alpha level equal to 0.01. Discuss the results of the test.Find the z-test statistic.
Determine a conclusion. Choose the correct answer below.
A.Do not reject H0, because the p-value is not less than the level of significance. Therefore, the statement that the population proportion exceeds 0.726 is not statistically supported by these sample data.
B.Reject H0, because the p-value is not less than the level of significance. Therefore, the statement that the population proportion exceeds 0.726 is not statistically supported by these sample data.
C.Do not reject H0, because the p-value is not less than the level of significance. Therefore, the statement that the population proportion exceeds 0.726 is statistically supported by these sample data.
D.Reject H0, because the p-value is not less than the level of significance. Therefore, the statement that the population proportion exceeds 0.726 is statistically supported by these sample data.
2)One of the editors of a major automobile publication has collected data on 30 of the best-selling cars in the United States. The data are shown in the accompanying table. The editor is particularly interested in the relationship between highway mileage (miles per gallon) and curb weight of the vehicles. Complete parts a through c below. Use a significance level of 0.05 where needed.
Discuss what the plot implies about the relationship between the two variables. Choose the correct answer below.A.A positive, linear relationship exists between x and y.B.A negative, linear relationship exists between x and y.C.A positive, curvilinear relationship exists between x and y.D.There is no relationship.
Compute the correlation coefficient for the two variables and test to determine whether there is a linear relationship between the curb weight and the highway mileage of automobiles. r= ? (Round to three decimal places as needed.)What are the appropriate hypotheses to test for a linear relationship?
Calculate the t-test statistic for correlation.
Determine the critical value(s) for the rejection region for the test statistic t. Select the correct choice below and fill in the answer box to complete your choice. Assume a significance level of 0.05 for the hypothesis test.
Since the test statistic ▼ isis not in the rejection region, ▼ do not rejectreject the null hypothesis. Conclude there ▼ is notis a significant linear relationship between the curb weight and the highway mileage of automobiles.
Compute the linear regression equation based on the sample data.
A car weighs approximately 4,020 pounds. Provide an estimate of the average highway mileage expected to obtain from this model.The expected highway mileage is
3)Suppose a random sample of 80 companies taken in 2005 showed that 20 offered high-deductible health insurance plans to their workers. A separate random sample of 100 firms taken in 2006 showed that 44 offered high-deductible health insurance plans to their workers. Based on the sample results, can you conclude that there is a higher proportion of companies offering high-deductible health insurance plans to their workers in 2006 than in 2005? Conduct your hypothesis test at a level of significance α=0.10.
Let p1 be the population proportion from 2006, and let p2 be the population proportion from 2005. Identify the null and alternative hypotheses. Choose the correct answer below.
H0: p1−p2=0HA: p1−p2≠0
B.H0: p1−p2≠0HA: p1−p2=0
C.H0: p1−p2≤0HA: p1−p2>0
D.H0: p1−p2>0HA: p1−p2≤0
E.H0: p1−p2<0HA: p1−p2≥0
Calculate the test statistic.
Find the p-value.
State the conclusion. Choose the correct answer below.
A.Reject the null hypothesis. There is not sufficient evidence at significance level α=0.05 that the mean past-due amount for customers who have been called is greater than $40.00.
B.Do not reject the null hypothesis. There is sufficient evidence at significance level α=0.05 that the mean past-due amount for customers who have been called is greater than $40.00.
C.Do not reject the null hypothesis. There is not sufficient evidence at significance level α=0.05 that the mean past-due amount for customers who have been called is not equal to $40.00.
D.Reject the null hypothesis. There is sufficient evidence at significance level α=0.05 that the mean past-due amount for customers who have been called is greater than $40.00.
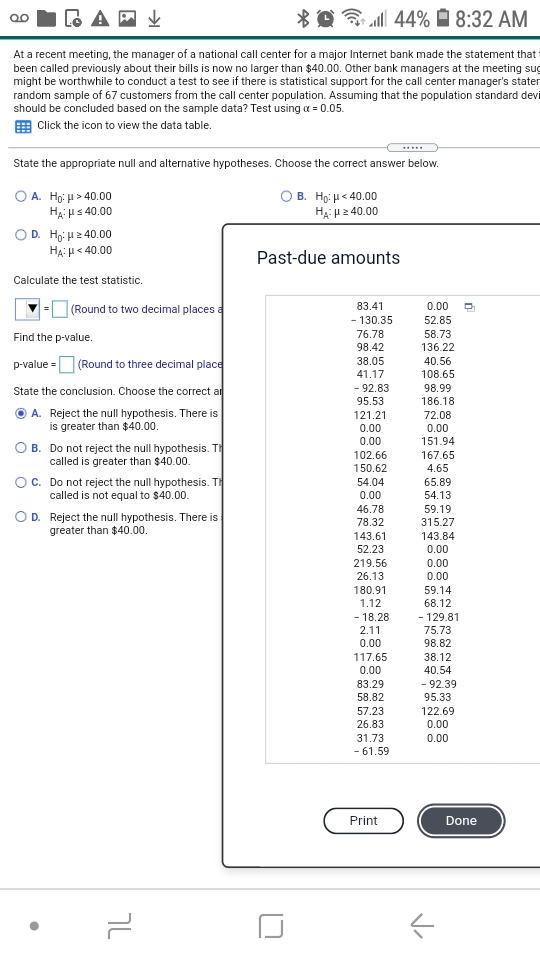
4)At a recent meeting, the manager of a national call center for a major Internet bank made the statement that the average past-due amount for customers who have been called previously about their bills is now no larger than $40.00. Other bank managers at the meeting suggested that this statement may be in error and that it might be worthwhile to conduct a test to see if there is statistical support for the call center manager's statement. The accompanying table contains data for a random sample of 67 customers from the call center population. Assuming that the population standard deviation for past due amounts is known to be $57.00, what should be concluded based on the sample data? Test using α=0.05.LOADING... Click the icon to view the data table.
State the appropriate null and alternative hypotheses. Choose the correct answer below.
A.H0: μ>40.00HA: μ≤40.00
B.H0: μ<40.00HA: μ≥40.00
C.H0: μ=40.00HA: μ≠40.00
D.H0: μ≥40.00HA: μ<40.00
E.H0: μ≠40.00HA: μ=
Calculate the test statistic.
Find the p-value.
State the conclusion. Choose the correct answer below.
5)A hotel chain wants to determine whether there is a difference in the length of stays at two of its different brands of hotels. A simple random sample of 100 stay lengths was taken for each hotel brand. These data are shown below. Assume that the variances are not equal.a) State the appropriate null and alternative hypotheses.b) Based on these sample data and a 0.05 level of significance, what conclusion should be made about the average length of stay at these two hotel chains?LOADING... Click the icon for sample data on the length of stays at these hotel chains.
a) State the appropriate null and alternative hypotheses. Let μ1 be the population mean length of stay at hotel brand 1, and let μ2 be the population mean length of stay at hotel brand 2.
b) Calculate the value of the test statistic.
Calculate the p-value.
State the appropriate conclusion for the hypothesis test.
6) A hotel chain wants to determine whether there is a difference in the length of stays at two of its different brands of hotels. A simple random sample of 100 stay lengths was taken for each hotel brand. These data are shown below. Assume that the variances are not equal.a) State the appropriate null and alternative hypotheses.b) Based on these sample data and a 0.05 level of significance, what conclusion should be made about the average length of stay at these two
State the appropriate null and alternative hypotheses. Let μ1 be the population mean length of stay at hotel brand 1, and let μ2 be the population mean length of stay at hotel brand 2.
Test statics?
P value?
Conclusion?
- @
- 6 orders completed
- ANSWER
-
Tutor has posted answer for $50.00. See answer's preview
**** attached ****