Waiting for answer This question has not been answered yet. You can hire a professional tutor to get the answer.
ASSIGNMENT: For this touchstone, you are going to analyze the sample data using the analytical techniques you have learned in Challenges 1.2, 2.1, and 2.2 and present your findings as a PowerPoint pre
ASSIGNMENT: For this touchstone, you are going to analyze the sample data using the analytical techniques you have learned in Challenges 1.2, 2.1, and 2.2 and present your findings as a PowerPoint presentation. Your audience is Carl, the owner of Carl’s Cookies. You should answer all of Carl’s questions in your presentation. Your analysis should be presented in a PowerPoint presentation that includes speaker notes, which explain your points. Use visualizations to summarize your findings.
Step 3: Read Carl's Questions
Question 1: Carl is offering several cookie varieties. He wants to optimize his operations by identifying underperforming cookies. Carl has provided you with sales data, including weekly cookie sales and selling prices, as well as associated costs. After analyzing customer feedback, Carl found trends in customer satisfaction:
- Peanut Butter Cookies: Consistently receive the lowest satisfaction ratings, with complaints about dryness and lack of flavor.
- Pumpkin Cookies: Average satisfaction ratings, with some customers mentioning they are too seasonal for year-round appeal.
- Macaron Cookies: Not always everyone’s favorite but have good customer satisfaction ratings overall.
Using the provided sales data, create a PivotTable (format as a heatmap) and a PivotChart of units of cookies sold by cookie type. Based on your findings and the customer feedback Carl supplied, recommend whether Carl should continue (or discontinue), improve, or expand production of specific cookie varieties. Specifically make sure to identify underperforming cookies using sales data, recommend whether to continue, improve, or discontinue specific varieties. (Slide #2)
Question 2: Carl wants to understand how his marketing strategies (flyer, coupon, tv, radio, and shopper) boost his store's sales. He has gathered data on the different marketing campaigns, including total gross sales, number of cookies sold, and marketing costs for each campaign. He gives you the following information about marketing to consider:
- The competition spends 10% of their gross sales on marketing.
- Carl spends about 7% of his gross sales on marketing.
- Studies show if Carl moves to social media marketing, he can cut his marketing costs to $300 per week, but he will also incur a 5% drop in gross sales.
Carl is seeking your assistance to analyze the effectiveness of these marketing strategies based on total gross sales, average gross sales per marketing media, and gross sales generated per marketing dollar spent. Visualize which type of marketing is the most effective overall and which one performs best on average. Based on the data and Carl’s insights, should he adjust his marketing strategy? (Slide #3)
Question 3: Carl is looking to understand the financial trends of his business and how he can navigate them while boosting weekly net income. He has provided data on his gross profit and all associated costs over several months. After reviewing costs for his business, Carl provides you with the following information:
- Selling Price per Cookie: Has remained unchanged at $3.50 for the past two years, but he is thinking about raising the price to $4.00 to keep up with rising costs.
- Utilities Cost: Generally stable, but there are rumors of rate hikes of 10%.
- Cost to Make Cookies: Variable, often influenced by inflation and commodity pricing. It is expected that these costs will increase by 6% in the next 12 months.
Carl is asking for your help to analyze his income trends, specifically focusing on net income (Net Income = Gross Profit – All Costs). Specifically, he wants to identify trends considering the following scenarios:
- Current weekly net income
- New weekly net income if he raised his prices to $4 per cookie and there are no cost increases
- The increase in weekly net income if prices increase to $4 per cookie but costs do not increase
- New net income per week if both costs and price of cookies increase
Based on this data, how could changing price and cost factors impact his overall profitability? Using the data and the information Carl provided, what are your recommendations to boost weekly net income? (Slide #4 and calculations on Slide #5)
Question 4: Carl is interested in understanding customer spending habits at his store. He has collected data on the average amount each customer spends per week. Carl notices the following trends:
- High-Spending Customers: A small percentage of customers make large purchases regularly (between $34 and $35).
- Moderate-Spending Customers: The majority of customers spend a consistent, moderate amount each week (between $28-$33). These customers can usually be upsold by $2-$3 per customer if deals are offered.
- Low-Spending Customers: Customers who make infrequent purchases ($27 or less) are often more demanding and want to sample cookies, increasing costs.
Carl is seeking your assistance to analyze the distribution of the average amount a customer spends per week. He wants to learn what insights can be drawn from this data to better understand customer behavior and improve his profit margin. What recommendations can you give, based on the data? (Slide #6)
Question 5: Carl wants to gain insight into the performance of his business throughout the year and has provided data on his gross sales in the spreadsheet. Carl’s business goals are:
- To attain quarter-over-quarter growth in gross sales of 5%
- To mediate any quarterly declines in sales
- To have his geometric mean per year average 5%
Based on the trend and geometric mean data you calculated and Carl’s goals, should Carl raise his prices, reduce the costs of the ingredients he uses in his cookies, or both? (Slide #7)
Question 6: In 2023, Carl began a discount incentive to help increase customer satisfaction. The incentive is that for any order over $30, the customer would receive 10% off their entire order. Carl has collected data on the number and cost of discounts given each week and the corresponding average customer satisfaction ratings. Carl wonders:
- Should I continue with the discounts?
- Are the costs of the discounts worth any potential increases in customer satisfaction?
- What if I discontinue the discounts?
Carl is seeking your assistance in determining the strength of any relationship between the number of discounts he gives each week and their corresponding customer satisfaction scores. Using this data, what advice would you give him that would answer his questions about the discounts? (Slide #8 and show calculations on Slide #9)
Question 7: Every quarter, Carl often ends up ordering too many ingredients because he does not have a valid model to reference for purchases. In addition, some ingredients for his cookies need a longer lead time to order. Because of these issues, Carl needs to understand the relationship between the business quarter and the type of cookies sold in that quarter. He has gathered data on the number of each type of cookie sold across the four business quarters for 2023. Carl has the following questions:
- Is there an effective model I can use to help me order ingredients?
- Are type of cookie and quarter sold dependent variables?
- Should I use the data I observed as a guide to help me order ingredients in the future?
Carl is seeking your assistance to analyze whether there is a significant association between the business quarter and the type of cookie sold. Based on the data, does Carl have a strong model he can use as a guide to order ingredients for upcoming quarters? (Slide #10)
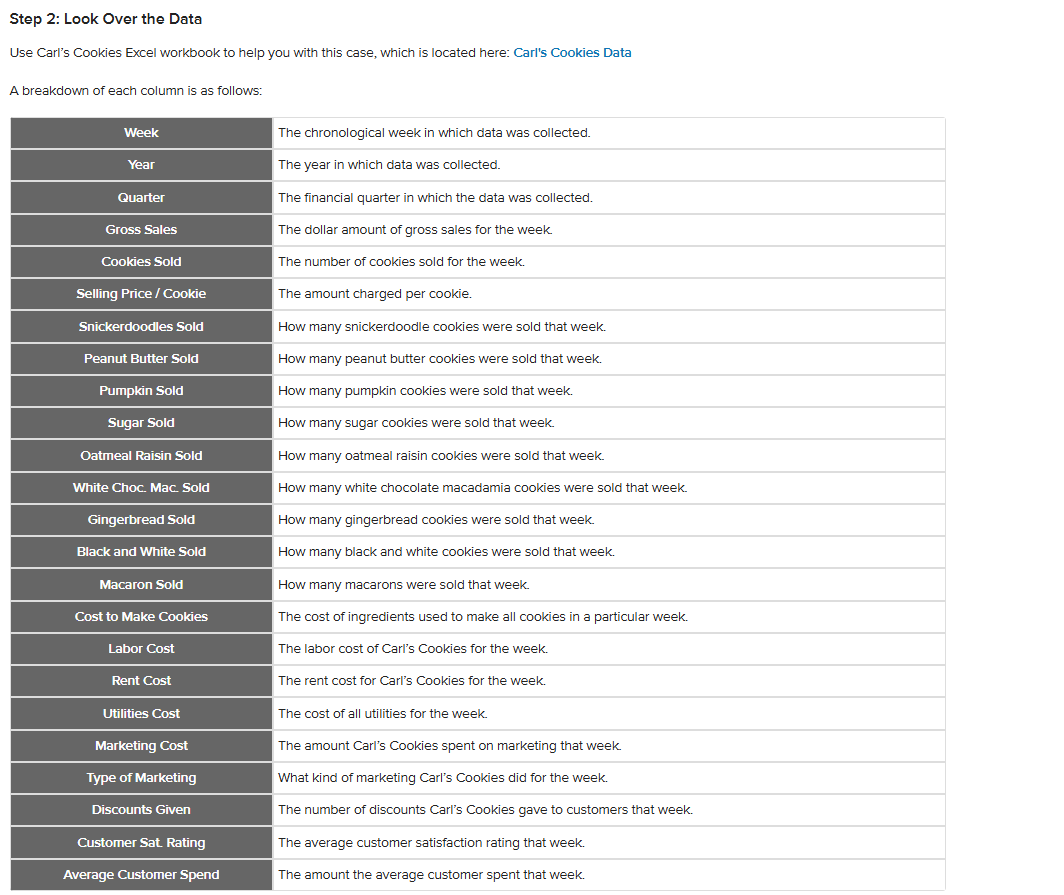
Step 4: Analyze the Provided Excel Dataset to Derive Insights
You should answer all of Carl’s questions in your presentation. Here is a basic template with slide headers that you can use, but it is not required.
Make sure to use visuals (graphs, tables, heatmaps) to enhance your findings. At minimum you should have 11 slides.
- Slide 1 – Title Slide
- Slide 2 – Question 1 on Product Performance Analysis
- Which cookies are underperforming, and what should Carl do?
- Analyze weekly sales and customer satisfaction ratings.
- Recommend whether Carl should discontinue, improve, or expand certain varieties.
- Slide 3 – Question 2 on Marketing Strategy Evaluation
- Slide 4 – Question 3 on Financial Trends Analysis
- Slide 5 – Excel Calculations for Financial Trends for Question #3
- Slide 6 – Question 4 on Customer Spending Behavior
- Slide 7 – Question 5 on Quarterly Sales Performance
- Slide 8 – Question 6 on Discount Incentive Effectiveness
- Slide 9 – Excel Calculations for Discounts for Question 6
- Slide 10 – Question 7 on Ingredient Ordering Model
- Slide 11 – Summary and Recommendations for Carl Slide
Step 5: Add Speaker Notes Explaining Your Methodology, Analysis, and Recommendations
Your analysis should be presented in a PowerPoint presentation that includes speaker notes, which should clearly explain your analysis and recommendations.
Speaker notes for each question should address the following:
- The data you used (and why you used that data) to answer the question.
- A justification of why you chose the data visualization you used.
- A detailed explanation of how the data supports your answer.
- The rationale of any calculations you made, if any.
my email: [email protected]
