Waiting for answer This question has not been answered yet. You can hire a professional tutor to get the answer.
QUESTION
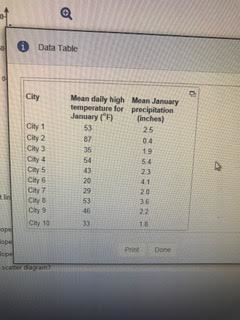
compute r and r^2 based on the data given above. Identify any outliers on the diagram and discuss their effects on the strength of the correlation...
compute r and r^2 based on the data given above.
c. Identify any outliers on the diagram and discuss their effects on the strength of the correlation and on the best-fit line. Choose the correct answer below.
A.
No outliers
B.
The point (0.40.4
Files:
untitled.png
