Waiting for answer This question has not been answered yet. You can hire a professional tutor to get the answer.
QUESTION
Data Science
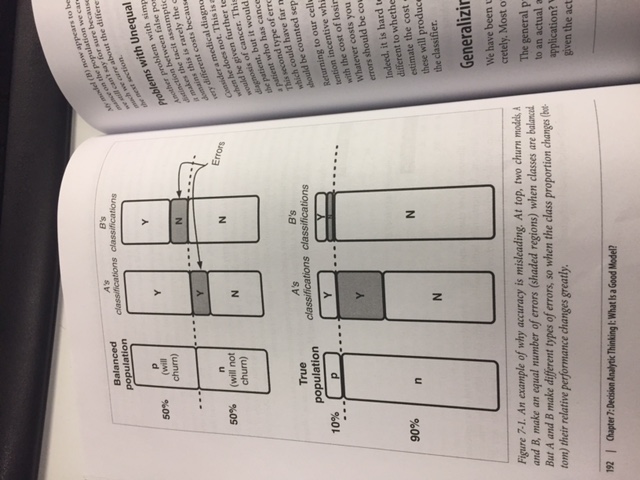
- Figure 7-1 on page 192 in the textbook demonstrates why accuracy calculation on an unbalanced population is misleading. Both model A and model B achieves 80% accuracy on the balanced population, but changes to 64% and 96% accuracy respectively on the true unbalanced population. If the population is more skewed with 5% positive and 95% negative, what are the accuracies for each model? Use the same 1000 customers to show your calculation and discuss the results.
- Confusion matrix of model A and model B are listed below for the true unbalanced population, extracted from Figure 7-1. Calculate the expected profit for both model A and model B using the following cost-benefit matrix. Discuss the results.
Cost-benefit matrix for the targeted marketing example
pnY100360N0540Confusion matrix of A
pnY600N40900Confusion matrix of B
Files:
2head9t0dm.jpg
