Answered You can hire a professional tutor to get the answer.
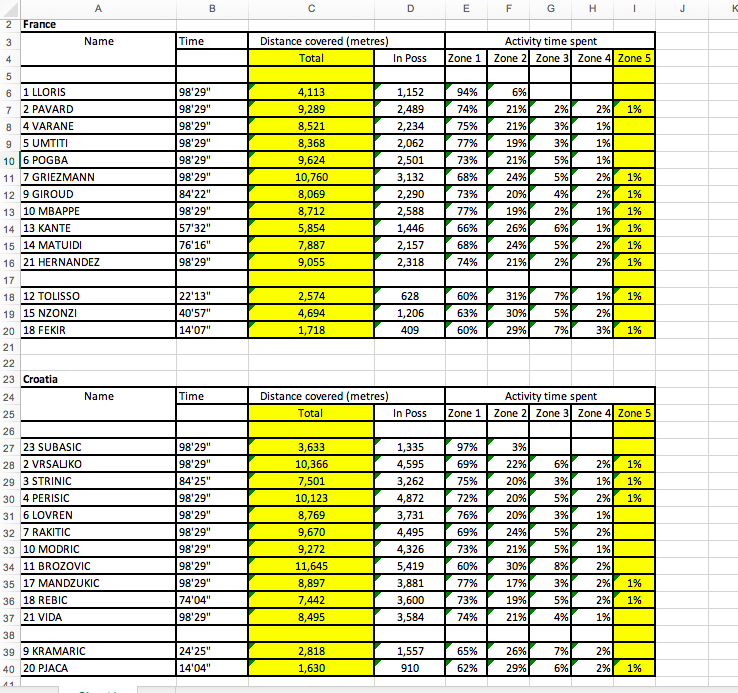
France Distance covered ( metres ) Activity time spent In Poss Zone 1 Zone 21 Zone 31 Zone 41 Zone 1 LLORIS 9829 1 , 152 2 PAVARD 98 20 ' 2
1.Data was collected from the 2018 FIFA World Cup final game between France and Croatia. Sport experts are interested to know which team on average covers greater distance during a game and how it affects the result of the game. Test the claim, at the 10% significance level, that the average distance covered by a Croatian player is greater than the average distance covered by a French player. (Use the excel file france croatia stat.xlsx on Sakai for finding the sample means and standard deviations)
(a) Find the sample mean and sample standard deviation of the distance covered by a player for each team.
(b) State the null and alternative hypotheses.
(c) Find the critical value and the test statistic.
(d) Should H0 be rejected at the 10% significance level? Does it mean that the average distance covered by a Croatian player is greater than the average distance covered by a French player?
(e) Construct an 80% confidence interval for the difference of the population means.
2.(Refer to the previous data france croatia stat.xlsx) Test the claim, at the 5% significance level, that the population proportion of Croatian players who spent any time in Zone 5 is greater than the proportion of French players who spent any time in Zone 5.
- (a) State the null and alternative hypotheses.
- (b) Find the critical value and the test statistic.
- (c) Should H0 be rejected at the 5% significance level? Does it mean that the population proportion of Croatian players who spent any time in Zone 5 is greater than the proportion of French players who spent any time in Zone 5?
