Waiting for answer This question has not been answered yet. You can hire a professional tutor to get the answer.
QUESTION
Here are a few graphs showing principal component analysis. Please explain the interpretation of the graphs below. What have the graphs taught me
Here are a few graphs showing principal component analysis. Please explain the interpretation of the graphs below. What have the graphs taught me about the relationship between the variables?
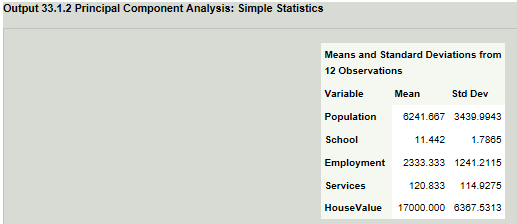
The five variables represent total population (Population), median school years (School), total employment (Employment), miscellaneous professional services (Services), and median house value (HouseValue).
GRAPHS:
Files:
a.png
