Answered You can hire a professional tutor to get the answer.
Question 33 1 pts Refer to the Exhibit Check Out Times. State your conclusion for the test. ta/2 lt; i; lt; tat/2 =gt; we reject H0. Therefore,...
Exhibit: Check Out Times.
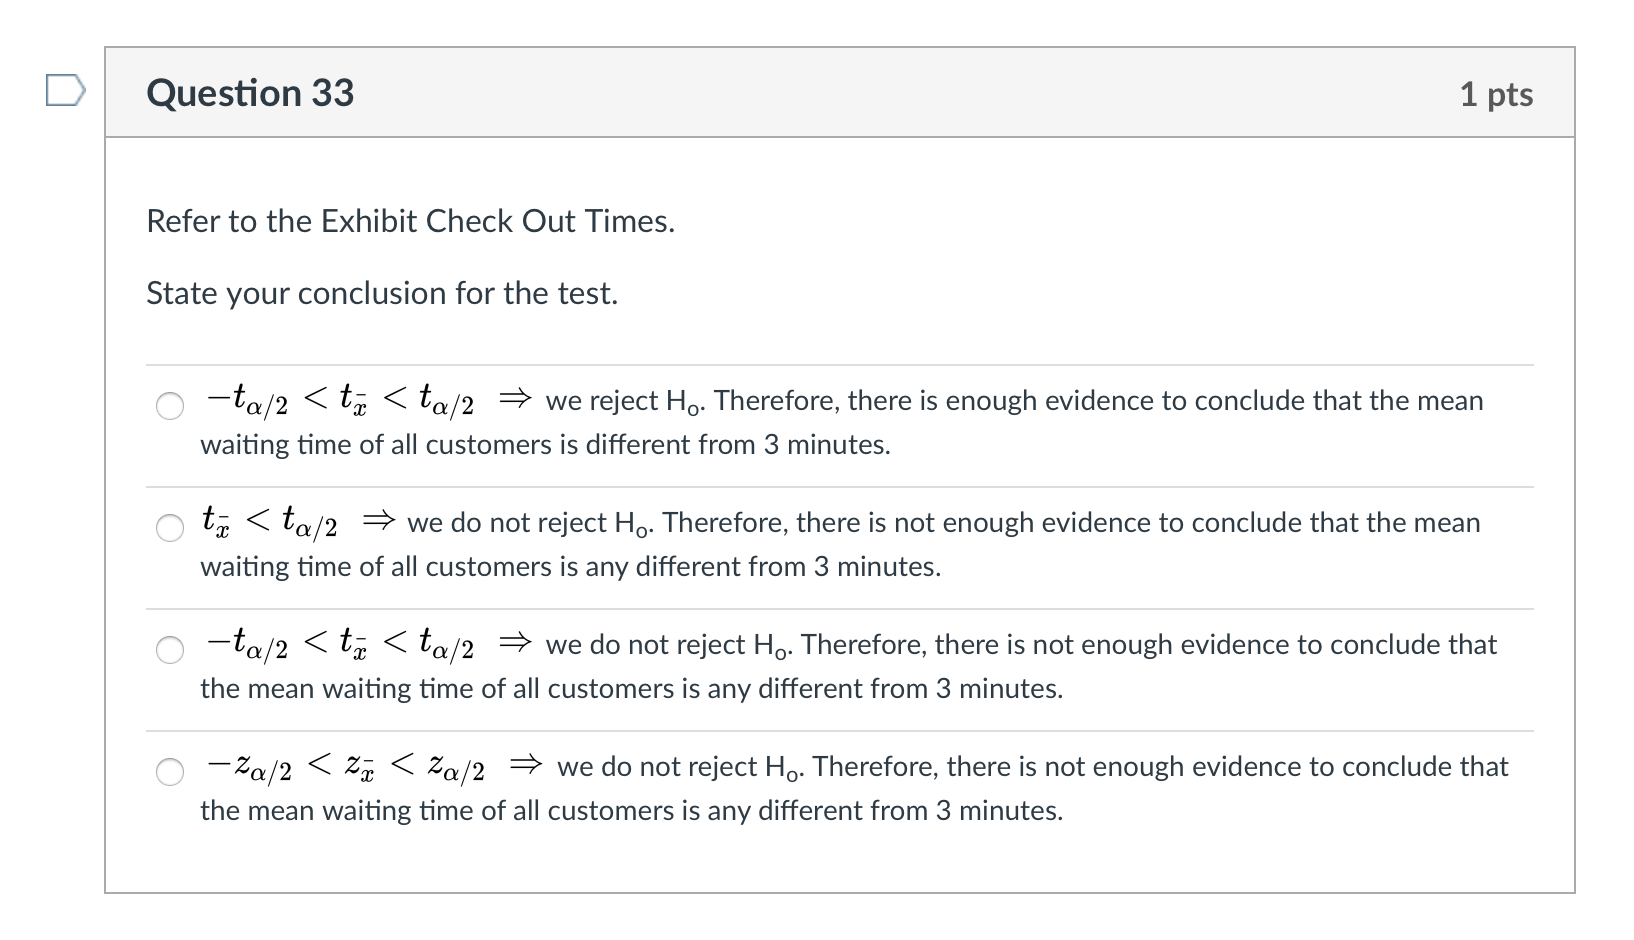
The manager of a grocery store has taken a random sample of 100 customers. The average length of time it took the customers in the sample to check out was 3.1 minutes with a standard deviation of 0.5 minutes. We want to test to determine whether or not the mean waiting time of all customers is any different from 3 minutes (use the significance level 0.02 for the test).
Round your solutions for this Exhibit to 4 digits.
Question 30
1 pts
Refer to the Exhibit Check Out Times.
Provide the null and the alternative hypotheses.
Question 31
0.5 pts
Refer to the Exhibit Check Out Times.
Compute the test statistic.
Question 32
1 pts
Refer to the Exhibit Check Out Times.
Calculate the critical value for the test.
Question 33
1 pts
Refer to the Exhibit Check Out Times.
State your conclusion for the test.
Exhibit: Tires Life Expectancy.
A tire manufacturer has been producing tires with an average life expectancy of 25,000 miles. Now the company is advertising that its new tires' life expectancy has increased. In order to test the legitimacy of the advertising campaign, an independent testing agency tested a sample of 6 of their tires and has provided the following data.
Life Expectancy
(In Thousands of Miles)
282725282925
Answer the following questions rounding your solutions to 4 digits.
Question 34
0.25 pts
Refer to the Exhibit Tires Life Expectancy.
Determine the standard deviation of life expectancy for the sample of tires.
Question 35
1 pts
Refer to the Exhibit Tires Life Expectancy.
Provide the null and the alternative hypotheses.
Question 36
0.5 pts
Refer to the Exhibit Tires Life Expectancy.
Compute the test statistic.
Question 37
1 pts
Refer to the Exhibit Tires Life Expectancy.
Compute the p-value for the test.
Question 38
1 pts
Refer to the Exhibit Tires Life Expectancy.
State your conclusion for the test using the p-value.
A. p-value < 0.03, so we reject Ho. Therefore, there is enough evidence to conclude that the mean life expectancy of the new tires has increased.
B. p-value < 0.03, so we do not reject Ho. Therefore, there is enough evidence to conclude that the mean life expectancy of the new tires has decreased.
C. p-value < 0.03, so we do not reject Ho. Therefore, there is not enough evidence to conclude that the mean life expectancy of the new tires has increased.
D. p-value < 0.03, so we reject Ho. Therefore, there is enough evidence to conclude that the mean life expectancy of the new tires has decreased.
Question 39
0.5 pts
Refer to the Exhibit Tires Life Expectancy.
Do we need any additional assumptions about the life expectancy of the tires in the population to make sure that the conclusion stated in the previous question is reliable?
A. No. The sample standard deviation can be calculated based on the given information, which guarantees that the conclusions derived in the test are reliable.
B. No. Using the information in the problem, we can calculate the test statistic and the p-value. So, everything is provided to conduct the test and obtain the conclusions without any additional information or any additional assumptions.
C. Yes. The population standard deviation of the life expectancy of the tires should be known to obtain reliable conclusions.
D. Yes. The life expectancy of the tires should follow the normal distribution in the population which would guarantee that the conclusions derived in the test are reliable.
